Create a plot showing the ERP at every channel as a single ERP image. By default, this attempts to find channel locations and rearrange the channels such that spatial patterns on the scalp are more discernible. It orders the rows from the most posterior electrode on the right hemisphere to the most anterior electrode on the left hemisphere, with midline electrodes in the middle. If no locations are found, it simply displays the data in its original order.
Arguments
- data
An
eeg_epochsobject- anat_order
Arrange the channels in a more anatomically representative order. Defaults to TRUE.
- time_lim
Time limits of plot - should be a character vector (e.g. c(-.2, .5))
- clim
Character vector of min and max values of plotting colour range. e.g. c(-5,5). Defaults to min and max.
- interpolate
Smooth the raster plot. Defaults to FALSE.
Author
Matt Craddock, matt@mattcraddock.com
Examples
library(ggplot2)
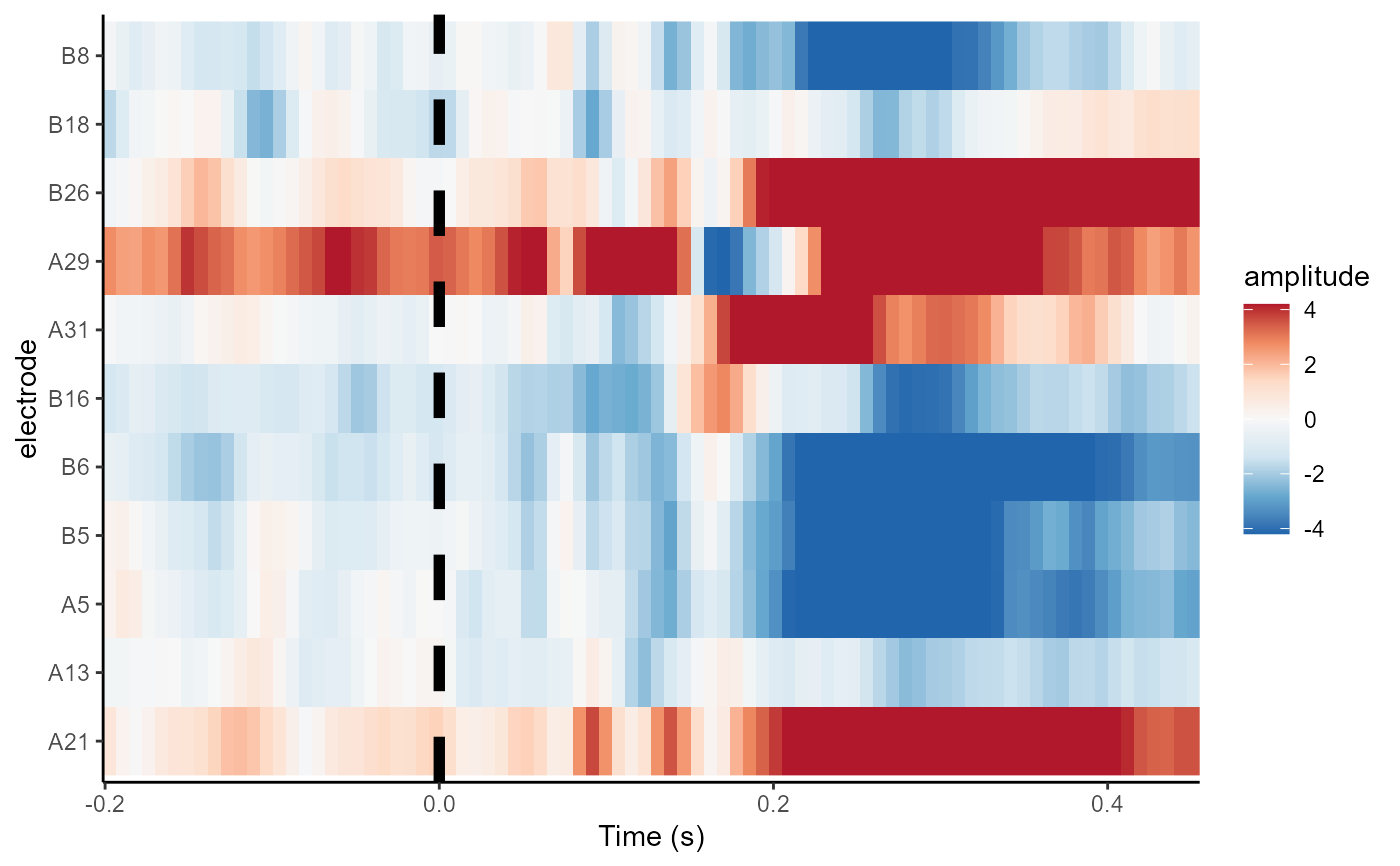
erp_raster(demo_epochs)
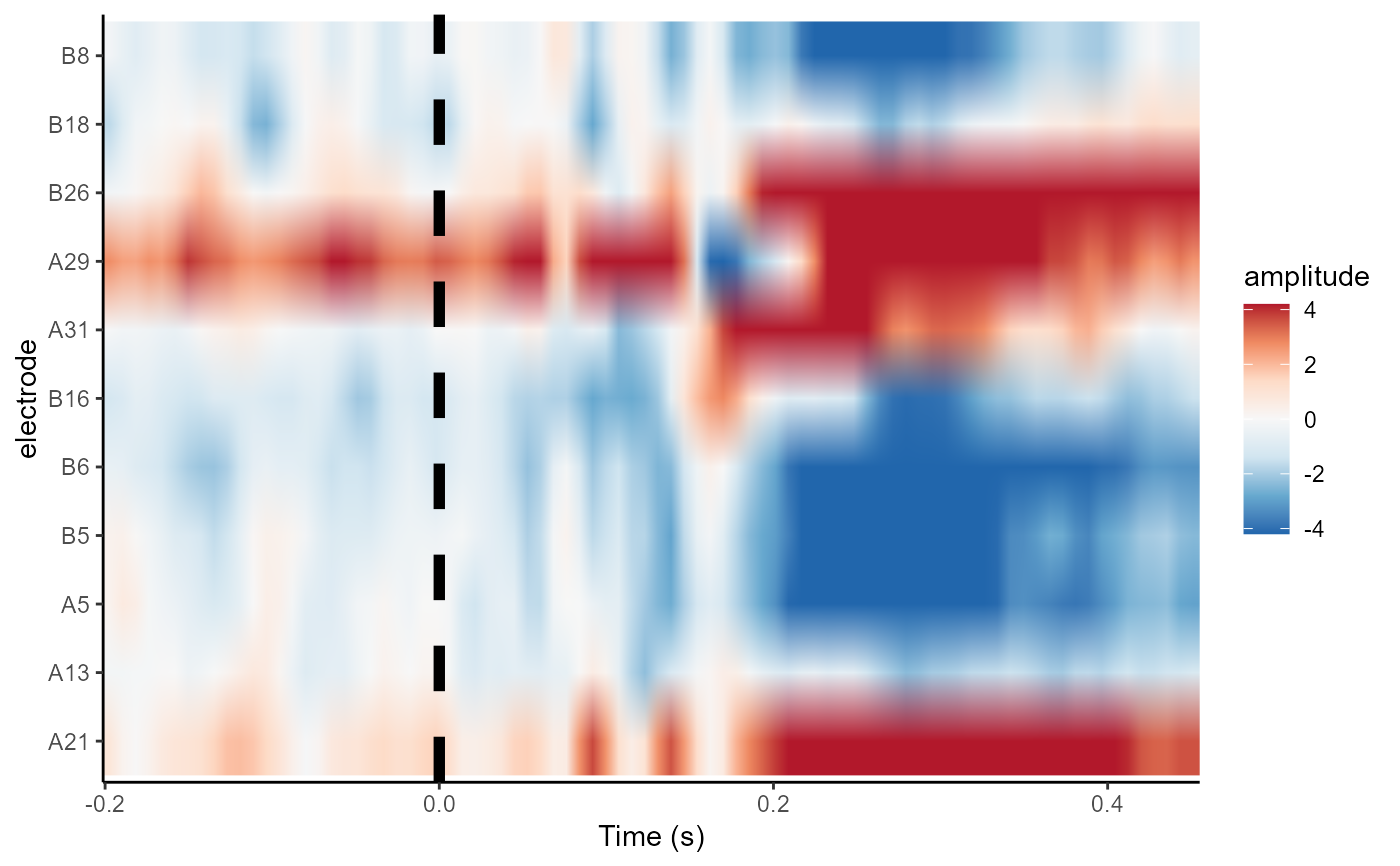
 erp_raster(demo_epochs, interpolate = TRUE)
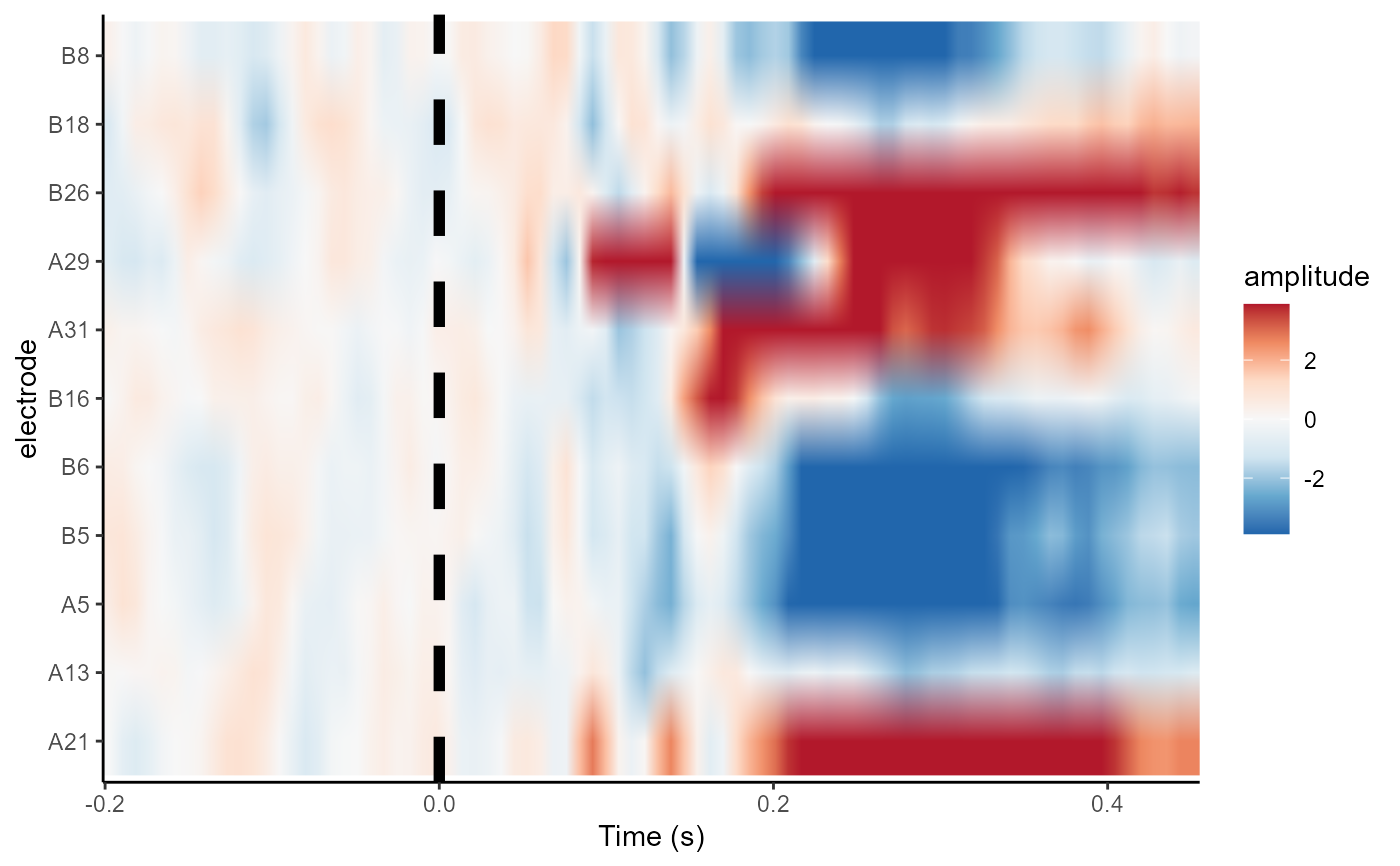
 erp_raster(rm_baseline(demo_epochs, c(-.1, 0)), interpolate = TRUE)
#> Baseline: -0.1 - 0s
erp_raster(rm_baseline(demo_epochs, c(-.1, 0)), interpolate = TRUE)
#> Baseline: -0.1 - 0s
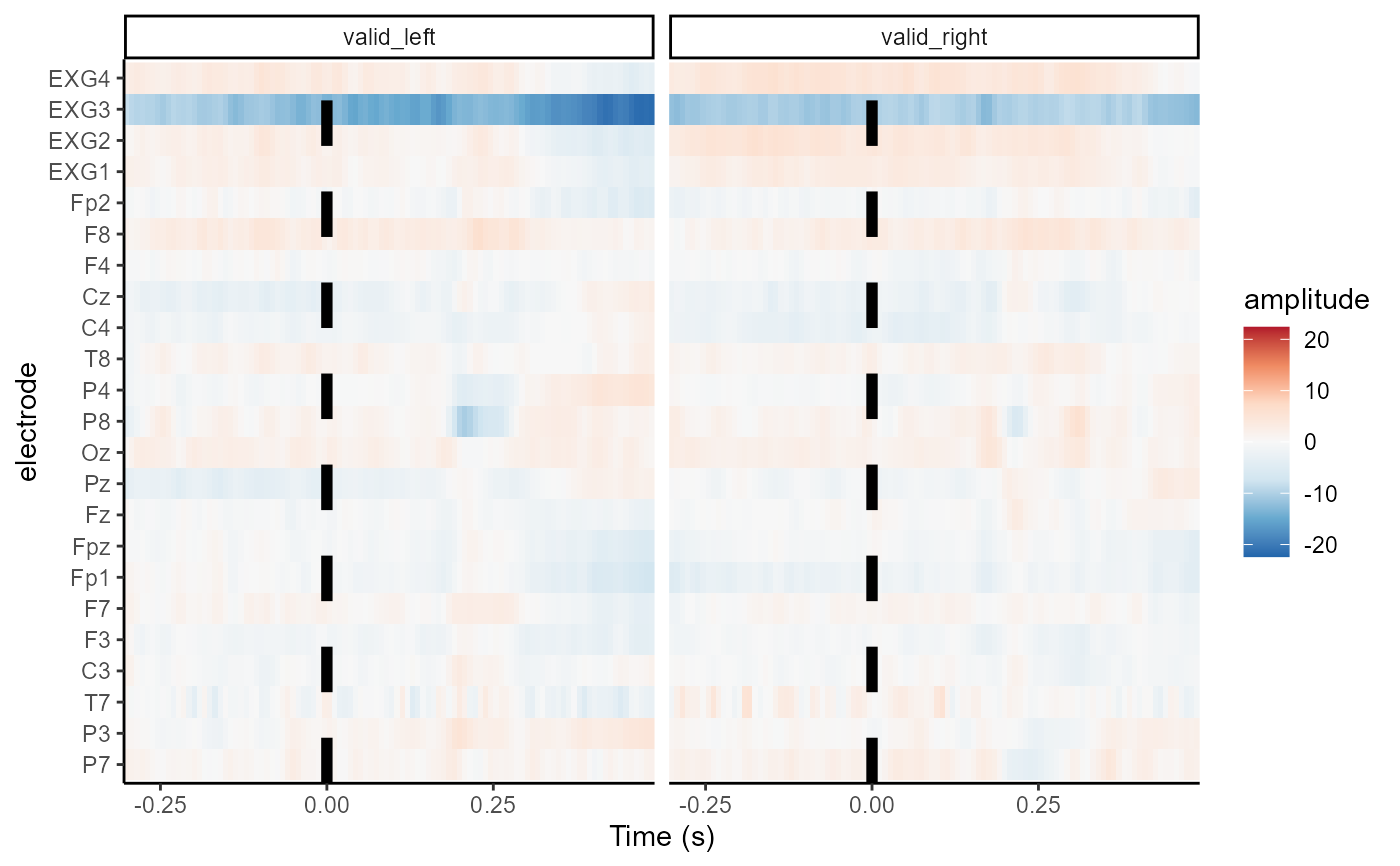
 erp_raster(demo_spatial) + facet_wrap(~epoch_labels)