Typically event-related potentials/fields, but could also be timecourses from frequency analyses for single frequencies. Output is a ggplot2 object. CIs not possible.
Usage
plot_butterfly(data, ...)

# Default S3 method
plot_butterfly(
  data,
  time_lim = NULL,
  baseline = NULL,
  legend = TRUE,
  continuous = FALSE,
  browse_mode = FALSE,
  allow_facets = FALSE,
  ...
)

# S3 method for class 'eeg_evoked'
plot_butterfly(
  data,
  time_lim = NULL,
  baseline = NULL,
  legend = TRUE,
  continuous = FALSE,
  browse_mode = FALSE,
  allow_facets = FALSE,
  ...
)

# S3 method for class 'eeg_data'
plot_butterfly(
  data,
  time_lim = NULL,
  baseline = NULL,
  legend = TRUE,
  allow_facets = FALSE,
  browse_mode = FALSE,
  ...
)

# S3 method for class 'eeg_epochs'
plot_butterfly(
  data,
  time_lim = NULL,
  baseline = NULL,
  legend = TRUE,
  allow_facets = FALSE,
  browse_mode = FALSE,
  ...
)

# S3 method for class 'eeg_stats'
plot_butterfly(
  data,
  time_lim = NULL,
  baseline = NULL,
  legend = TRUE,
  allow_facets = FALSE,
  browse_mode = FALSE,
  quantity = "statistic",
  ...
)

# S3 method for class 'eeg_lm'
plot_butterfly(
  data,
  time_lim = NULL,
  baseline = NULL,
  legend = TRUE,
  allow_facets = FALSE,
  browse_mode = FALSE,
  quantity = "coefficients",
  ...
)
Arguments
- data
EEG dataset. Should have multiple timepoints.
- ...
Other parameters passed to
plot_butterfly- time_lim
Character vector. Numbers in whatever time unit is used specifying beginning and end of time-range to plot. e.g. c(-.1,.3)
- baseline
Character vector. Times to use as a baseline. Takes the mean over the specified period and subtracts. e.g. c(-.1, 0)
- legend
Include plot legend. Defaults to TRUE.
- continuous
Is the data continuous or not (I.e. epoched)
- browse_mode
Applies custom theme used with
browse_data().- allow_facets
Allow use of ggplot2 facetting. See note below. Defaults to FALSE.
- quantity
Which aspect of the linear model you want to be plotted. only applies to
eeg_lmobjects
Methods (by class)
plot_butterfly(default): Defaultplot_butterflymethod for data.frames,eeg_dataplot_butterfly(eeg_evoked): Plot butterfly foreeg_evokedobjectsplot_butterfly(eeg_data): Create butterfly plot foreeg_dataobjectsplot_butterfly(eeg_epochs): Create butterfly plot foreeg_epochsobjectsplot_butterfly(eeg_stats): Create butterfly plot foreeg_statsobjectsplot_butterfly(eeg_lm): Create butterfly plot foreeg_lmobjects
Notes on ggplot2 facetting
In order for ggplot2 facetting to work, the data has to be plotted using
stat_summary() rather than geom_line(), so that the plots can still be
made when not all categorical variables are reflected in the facets. e.g.
if there are two variables with two levels each, but you want to average
over one of those variables, stat_summary() is required. However,
stat_summary() can be extremely slow with a large number of timepoints,
electrodes, and epochs.
Author
Matt Craddock, matt@mattcraddock.com
Examples
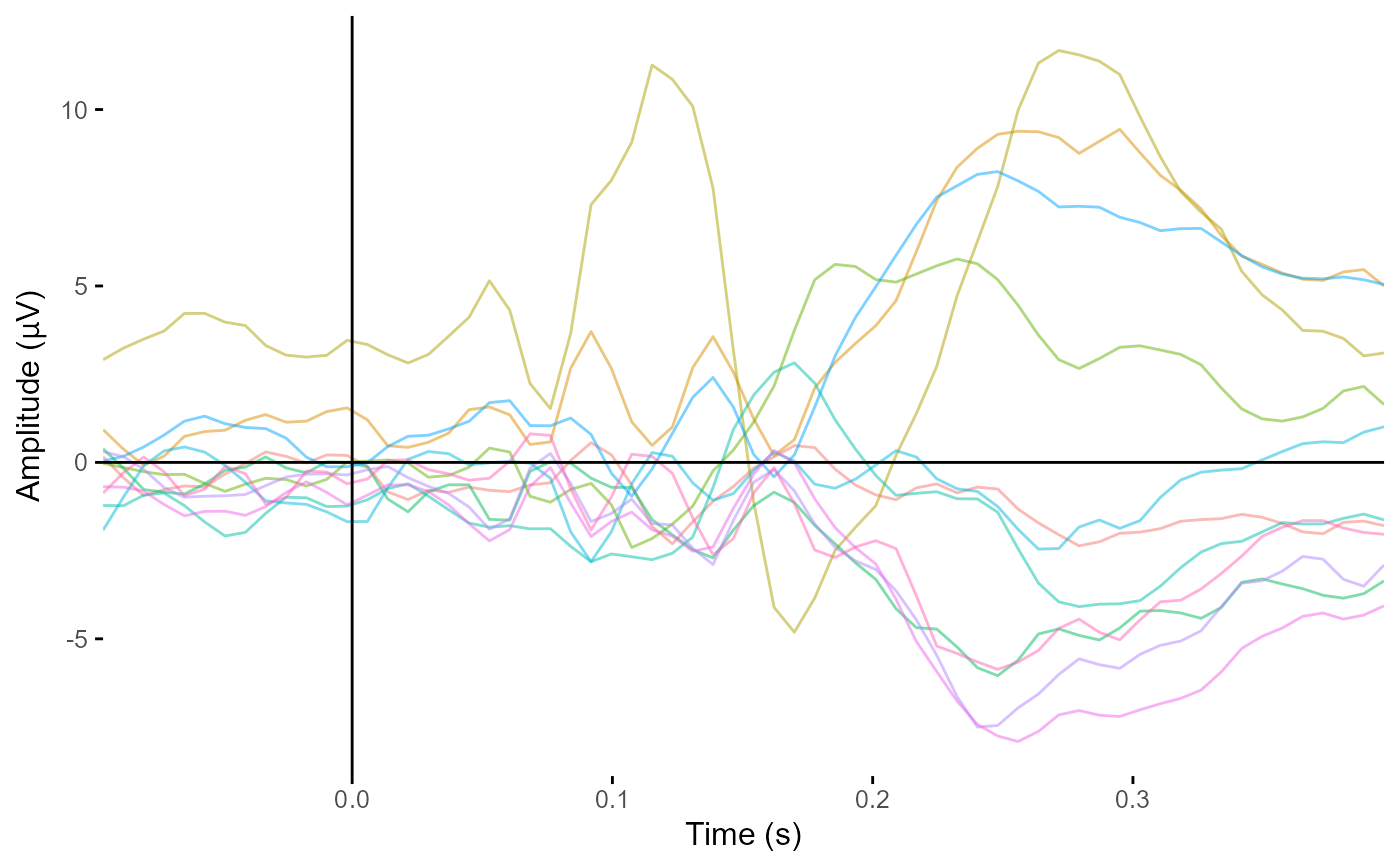
plot_butterfly(demo_epochs)
#> Creating epochs based on combinations of variables: epoch_label participant_id
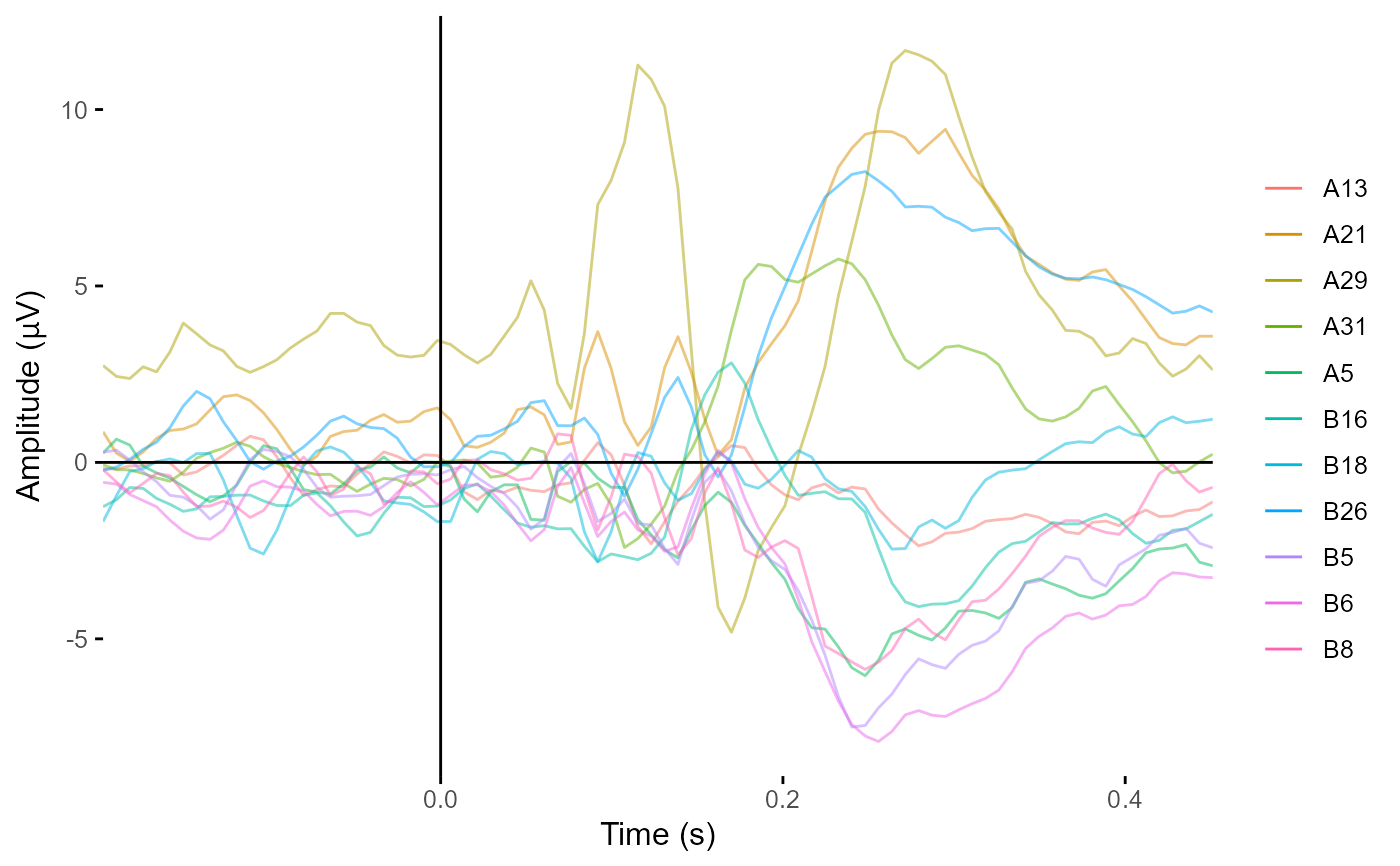 plot_butterfly(demo_epochs,
time_lim = c(-.1, .4),
legend = FALSE)
#> Creating epochs based on combinations of variables: epoch_label participant_id
plot_butterfly(demo_epochs,
time_lim = c(-.1, .4),
legend = FALSE)
#> Creating epochs based on combinations of variables: epoch_label participant_id