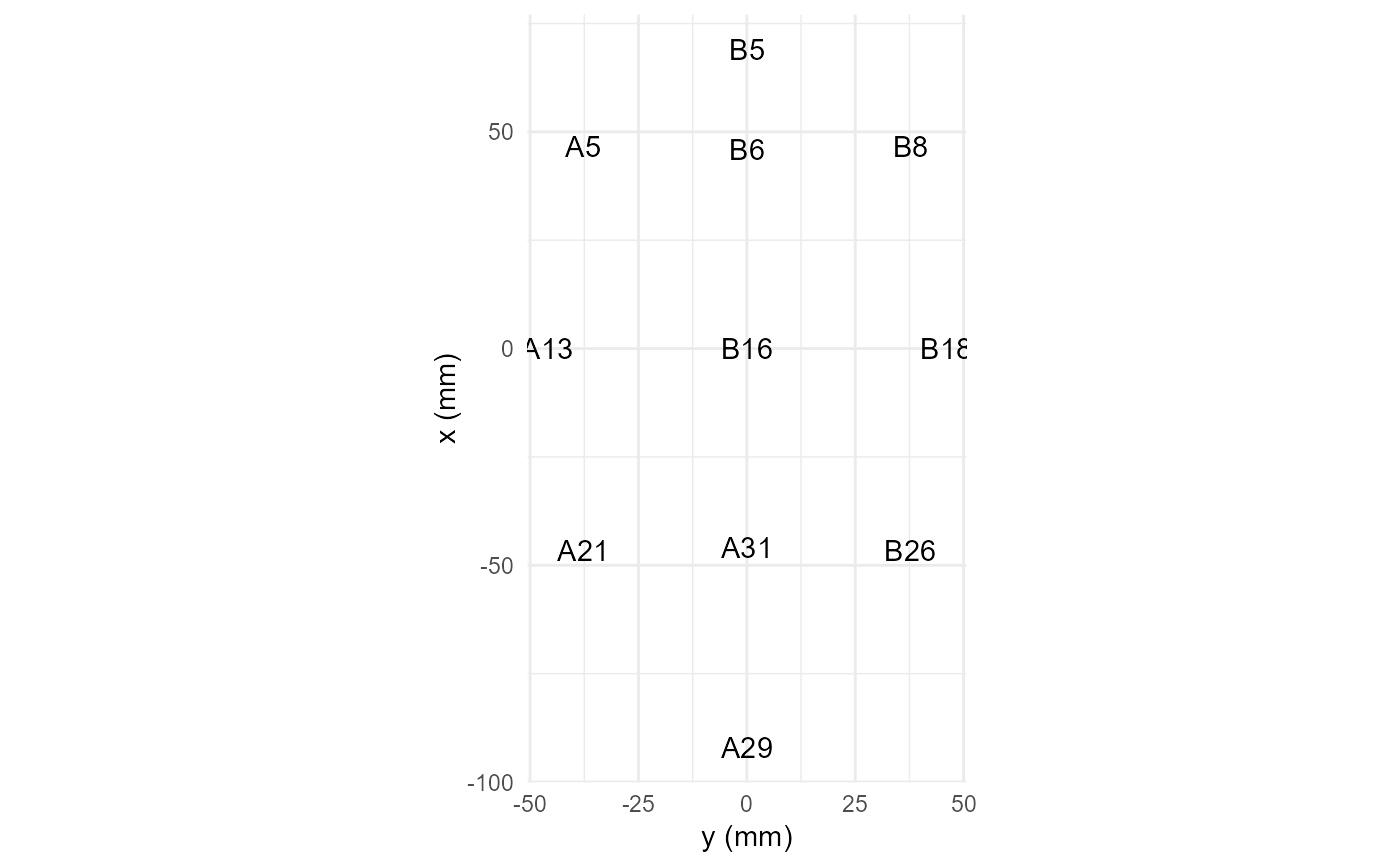
Produces either a 2D plot of the electrode locations or an interactive plot of electrode locations in 3D space.
Usage
plot_electrodes(data, interact = FALSE)

# Default S3 method
plot_electrodes(data, interact = FALSE)

# S3 method for class 'eeg_data'
plot_electrodes(data, interact = FALSE)

# S3 method for class 'eeg_evoked'
plot_electrodes(data, interact = FALSE)

# S3 method for class 'eeg_tfr'
plot_electrodes(data, interact = FALSE)Methods (by class)
plot_electrodes(default): generic plot electrodes functionplot_electrodes(eeg_data): Plot electrodes associated with aneeg_dataobject.plot_electrodes(eeg_evoked): Plot electrodes associated with aneeg_evokedobject.plot_electrodes(eeg_tfr): Plot electrodes associated with aneeg_dataobject.
Author
Matt Craddock matt@mattcraddock.com