Typically event-related potentials/fields, but could also be timecourses from
frequency analyses for single frequencies. Averages over all submitted
electrodes. For group data, plot_timecourse will average within-participants
first, using weighted averaging where possible, then across participants using
unweighted averaging. Output is a ggplot2 object.
Usage
plot_timecourse(data, ...)

# S3 method for class 'data.frame'
plot_timecourse(
  data,
  electrode = NULL,
  time_lim = NULL,
  add_CI = FALSE,
  baseline = NULL,
  colour = NULL,
  color = NULL,
  mapping = NULL,
  facets = NULL,
  ...
)

# S3 method for class 'eeg_evoked'
plot_timecourse(
  data,
  electrode = NULL,
  time_lim = NULL,
  add_CI = FALSE,
  baseline = NULL,
  colour = NULL,
  color = NULL,
  mapping = NULL,
  facets = NULL,
  ...
)

# S3 method for class 'eeg_ICA'
plot_timecourse(
  data,
  component = NULL,
  time_lim = NULL,
  add_CI = FALSE,
  baseline = NULL,
  colour = NULL,
  color = NULL,
  mapping = NULL,
  facets = NULL,
  ...
)

# S3 method for class 'eeg_epochs'
plot_timecourse(
  data,
  electrode = NULL,
  time_lim = NULL,
  add_CI = FALSE,
  baseline = NULL,
  colour = NULL,
  color = NULL,
  mapping = NULL,
  facets = NULL,
  ...
)

# S3 method for class 'eeg_group'
plot_timecourse(
  data,
  electrode = NULL,
  time_lim = NULL,
  add_CI = FALSE,
  baseline = NULL,
  colour = NULL,
  color = NULL,
  mapping = NULL,
  facets = NULL,
  ...
)

# S3 method for class 'eeg_tfr'
plot_timecourse(
  data,
  electrode = NULL,
  time_lim = NULL,
  add_CI = FALSE,
  baseline = NULL,
  colour = NULL,
  color = NULL,
  mapping = NULL,
  freq_range = NULL,
  type = "divide",
  ...
)
Arguments
- data
EEG dataset. Should have multiple timepoints.
- ...
Other arguments passed to methods.
- electrode
Electrode(s) to plot.
- time_lim
Character vector. Numbers in whatever time unit is used specifying beginning and end of time-range to plot. e.g. c(-.1, .3)
- add_CI
Add confidence intervals to the graph. Defaults to 95 percent between-subject CIs.
- baseline
Character vector. Times to use as a baseline. Takes the mean over the specified period and subtracts. e.g. c(-.1,0)
- colour
Variable to colour lines by. If no variable is passed, only one line is drawn.
- color
Alias for colour.
- mapping
A
ggplot2aes()mapping.- facets
A right-hand-side only formula specifying which variables should be used to create facets.
- component
name or number of ICA component to plot
- freq_range
Choose a specific frequency range to plot. If NULL, calculates the mean over all frequencies. Note that this does not imply that there is power at an included frequency. For example, lower frequencies will have shorter timecourses than high frequencies.
- type
Type of baseline correction to use for
eeg_tfrobjects
Methods (by class)
plot_timecourse(data.frame): Plot a data.frame timecourseplot_timecourse(eeg_evoked): ploteeg_evokedtimecoursesplot_timecourse(eeg_ICA): Plot individual components fromeeg_ICAcomponentsplot_timecourse(eeg_epochs): Plot timecourses fromeeg_epochsobjects.plot_timecourse(eeg_group): Plot timecourses fromeeg_groupobjects.plot_timecourse(eeg_tfr): Plot timecourses fromeeg_tfrobjects.
Author
Matt Craddock, matt@mattcraddock.com
Examples
library(ggplot2)
plot_timecourse(demo_epochs, "A29")
#> Creating epochs based on combinations of variables: participant_id
#> Ignoring unknown labels:
#> • colour : ""
#> • fill : ""
 plot_timecourse(demo_epochs, "A29", baseline = c(-.1, 0))
#> Baseline: -0.1 - 0s
#> Creating epochs based on combinations of variables: participant_id
#> Ignoring unknown labels:
#> • colour : ""
#> • fill : ""
plot_timecourse(demo_epochs, "A29", baseline = c(-.1, 0))
#> Baseline: -0.1 - 0s
#> Creating epochs based on combinations of variables: participant_id
#> Ignoring unknown labels:
#> • colour : ""
#> • fill : ""
 plot_timecourse(demo_epochs, "A29", baseline = c(-.1, 0), add_CI = TRUE)
#> Baseline: -0.1 - 0s
#> Warning: Using `size` aesthetic for lines was deprecated in ggplot2 3.4.0.
#> ℹ Please use `linewidth` instead.
#> ℹ The deprecated feature was likely used in the eegUtils package.
#> Please report the issue at <https://github.com/craddm/eegUtils/issues>.
#> Ignoring unknown labels:
#> • colour : ""
#> • fill : ""
plot_timecourse(demo_epochs, "A29", baseline = c(-.1, 0), add_CI = TRUE)
#> Baseline: -0.1 - 0s
#> Warning: Using `size` aesthetic for lines was deprecated in ggplot2 3.4.0.
#> ℹ Please use `linewidth` instead.
#> ℹ The deprecated feature was likely used in the eegUtils package.
#> Please report the issue at <https://github.com/craddm/eegUtils/issues>.
#> Ignoring unknown labels:
#> • colour : ""
#> • fill : ""
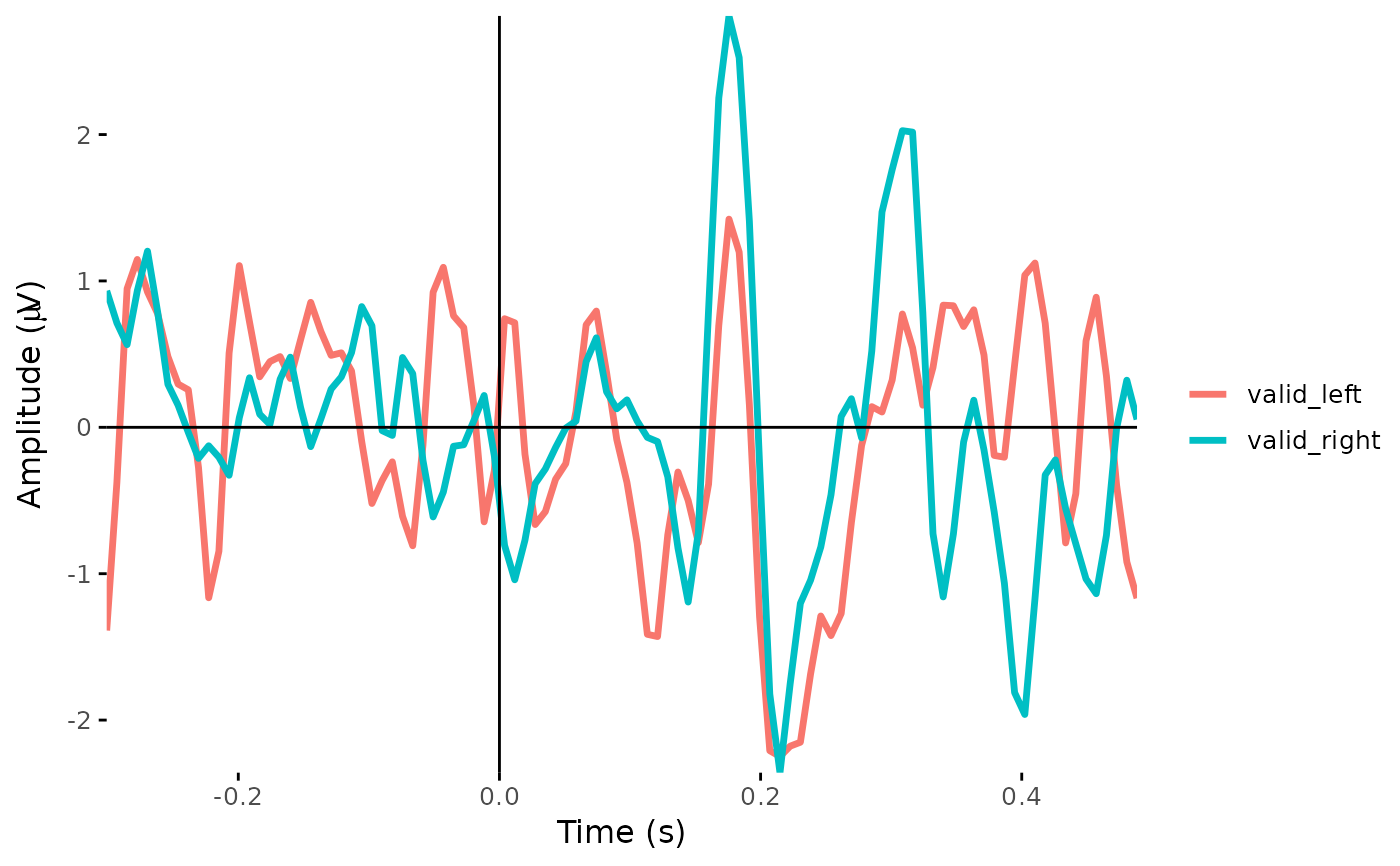
 plot_timecourse(demo_spatial, "Oz", baseline = c(-.1, 0), mapping = aes(colour = epoch_labels))
#> Baseline: -0.1 - 0s
#> Creating epochs based on combinations of variables: participant_id epoch_labels
#> Ignoring unknown labels:
#> • fill : ""
plot_timecourse(demo_spatial, "Oz", baseline = c(-.1, 0), mapping = aes(colour = epoch_labels))
#> Baseline: -0.1 - 0s
#> Creating epochs based on combinations of variables: participant_id epoch_labels
#> Ignoring unknown labels:
#> • fill : ""
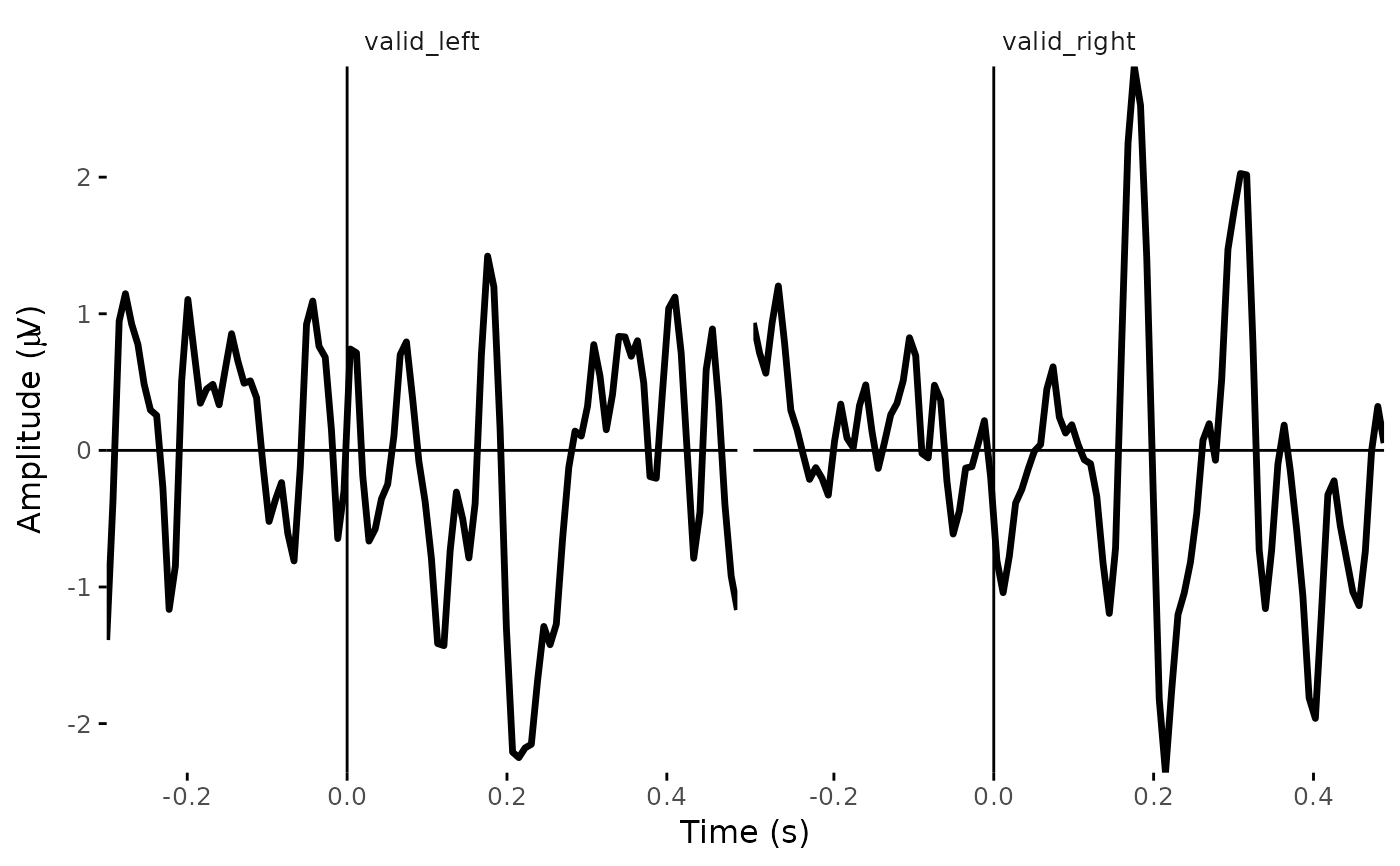
 plot_timecourse(demo_spatial, "Oz", baseline = c(-.1, 0), facets = ~epoch_labels)
#> Baseline: -0.1 - 0s
#> Creating epochs based on combinations of variables: participant_id epoch_labels
#> Ignoring unknown labels:
#> • colour : ""
#> • fill : ""
plot_timecourse(demo_spatial, "Oz", baseline = c(-.1, 0), facets = ~epoch_labels)
#> Baseline: -0.1 - 0s
#> Creating epochs based on combinations of variables: participant_id epoch_labels
#> Ignoring unknown labels:
#> • colour : ""
#> • fill : ""