Allows topographical plotting of functional data. Output is a ggplot2 object.
Usage
topoplot(data, ...)

# Default S3 method
topoplot(data, ...)

# S3 method for class 'data.frame'
topoplot(
  data,
  time_lim = NULL,
  limits = NULL,
  chanLocs = NULL,
  method = "Biharmonic",
  r = NULL,
  grid_res = 200,
  palette = "RdBu",
  interp_limit = "skirt",
  contour = TRUE,
  chan_marker = "point",
  quantity = "amplitude",
  montage = NULL,
  highlights = NULL,
  scaling = 1,
  groups = NULL,
  verbose = TRUE,
  k = 40,
  fill_title = expression(paste("Amplitude (", mu, "V)")),
  ...
)

# S3 method for class 'eeg_data'
topoplot(
  data,
  time_lim = NULL,
  limits = NULL,
  chanLocs = NULL,
  method = "Biharmonic",
  r = NULL,
  grid_res = 200,
  palette = "RdBu",
  interp_limit = "skirt",
  contour = TRUE,
  chan_marker = "point",
  quantity = "amplitude",
  montage = NULL,
  highlights = NULL,
  scaling = 1,
  verbose = TRUE,
  groups = NULL,
  k = 40,
  fill_title = expression(paste("Amplitude (", mu, "V)")),
  ...
)

# S3 method for class 'eeg_epochs'
topoplot(
  data,
  time_lim = NULL,
  limits = NULL,
  chanLocs = NULL,
  method = "Biharmonic",
  r = NULL,
  grid_res = 200,
  palette = "RdBu",
  interp_limit = "skirt",
  contour = TRUE,
  chan_marker = "point",
  quantity = "amplitude",
  montage = NULL,
  highlights = NULL,
  scaling = 1,
  groups = NULL,
  verbose = TRUE,
  k = 40,
  fill_title = expression(paste("Amplitude (", mu, "V)")),
  ...
)

# S3 method for class 'eeg_ICA'
topoplot(
  data,
  component,
  time_lim = NULL,
  limits = NULL,
  chanLocs = NULL,
  method = "Biharmonic",
  r = NULL,
  grid_res = 200,
  palette = "RdBu",
  interp_limit = "skirt",
  contour = TRUE,
  chan_marker = "point",
  quantity = "amplitude",
  montage = NULL,
  highlights = NULL,
  scaling = 1,
  verbose = TRUE,
  groups = NULL,
  k = 40,
  fill_title = "a.u.",
  ...
)

# S3 method for class 'eeg_tfr'
topoplot(
  data,
  time_lim = NULL,
  limits = NULL,
  chanLocs = NULL,
  method = "Biharmonic",
  r = NULL,
  grid_res = 200,
  palette = "RdBu",
  interp_limit = "skirt",
  contour = TRUE,
  chan_marker = "point",
  quantity = "power",
  montage = NULL,
  highlights = NULL,
  scaling = 1,
  freq_range = NULL,
  verbose = TRUE,
  groups = NULL,
  k = 40,
  fill_title = expression(paste("Power (", mu, V^2, ")")),
  ...
)
Arguments
- data
An EEG dataset. If the input is a data.frame, then it must have columns
electrode,x,y, andamplitude.xandyshould be (Cartesian) electrode co-ordinates.- ...
Various arguments passed to specific functions
- time_lim
Timepoint(s) to plot. Can be one time, a range to average over, or a list of individual times. If none is supplied, the function will average across all timepoints in the supplied data.
- limits
Limits of the fill scale - should be given as a character vector with two values specifying the start and endpoints e.g. limits = c(-2,-2). Will ignore anything else. Defaults to the range of the data.
- chanLocs
Allows passing of channel locations (see
electrode_locations)- method
Interpolation method. "Biharmonic" or "gam". "Biharmonic" implements the same method used in Matlab's EEGLAB. "gam" fits a Generalized Additive Model with k = 40 knots. Defaults to biharmonic spline interpolation.
- r
Radius of cartoon head_shape in mm. Default value is 95 (mm) when using
interp_limit = "skirt".- grid_res
Resolution of the interpolated grid. Higher = smoother but slower. Defaults to 200 points per edge.
- palette
Defaults to RdBu if none supplied. Can be any palette from RColorBrewer or viridis. If an unsupported palette is specified, switches to Greens.
- interp_limit
"skirt" or "head". Defaults to "skirt". "skirt" interpolates just past the farthest electrode and does not respect the boundary of the head_shape. "head" interpolates up to the radius of the plotted head, and moves all electrodes inside the head.
- contour
Plot contour lines on topography (defaults to TRUE)
- chan_marker
Set marker for electrode locations. "point" = point, "name" = electrode name, "none" = no marker. Defaults to "point".
- quantity
Allows plotting of an arbitrary quantitative column. Defaults to amplitude. Use quoted column names. E.g. "p.value", "t_statistic".
- montage
Name of an existing montage set. Defaults to NULL. (currently only 'biosemi64alpha' available other than default 10/20 system)
- highlights
Electrodes to highlight (in white).
- scaling
Scaling multiplication factor for labels and any plot lines. Defaults to 1.
- groups
Column name for groups to retain. This is required to create facetted plots.
- verbose
Warning messages when electrodes do not have locations. Defaults to TRUE.
- k
Degrees of freedom used for spline when using
method = gam. Defaults to 40.- fill_title
Allows specification of the title of the colourbar. Defaults to `expression(paste("Amplitude (", mu, "V)")), appropriate for typical time-domain data.
- component
Component to plot (numeric)
- freq_range
Range of frequencies to average over.
Methods (by class)
topoplot(default): Default method for data frames.topoplot(data.frame): Topographical plotting of data.frames and other noneeg_dataobjects.topoplot(eeg_data): Topographical plotting ofeeg_dataobjects.topoplot(eeg_epochs): Topographical plotting ofeeg_epochsobjects.topoplot(eeg_ICA): Topographical plot foreeg_ICAobjectstopoplot(eeg_tfr): Topographical plotting ofeeg_tfrobjects.
Notes on usage of Generalized Additive Models for interpolation
The
function fits a GAM using the gam function from mgcv. Specifically, it
fits a spline using the model function gam(z ~ s(x, y, bs = "ts", k = 40). Using GAMs for smooths is very much experimental. The surface is
produced from the predictions of the GAM model fitted to the supplied data.
Values at each electrode do not necessarily match actual values in the
data: high-frequency variation will tend to be smoothed out. Thus, the
method should be used with caution. In addition the method can only be used
when there are more than 40 electrodes.
See also
Other scalp-based maps:
erp_scalp(),
interactive_scalp()
Author
Matt Craddock, matt@mattcraddock.com
Examples
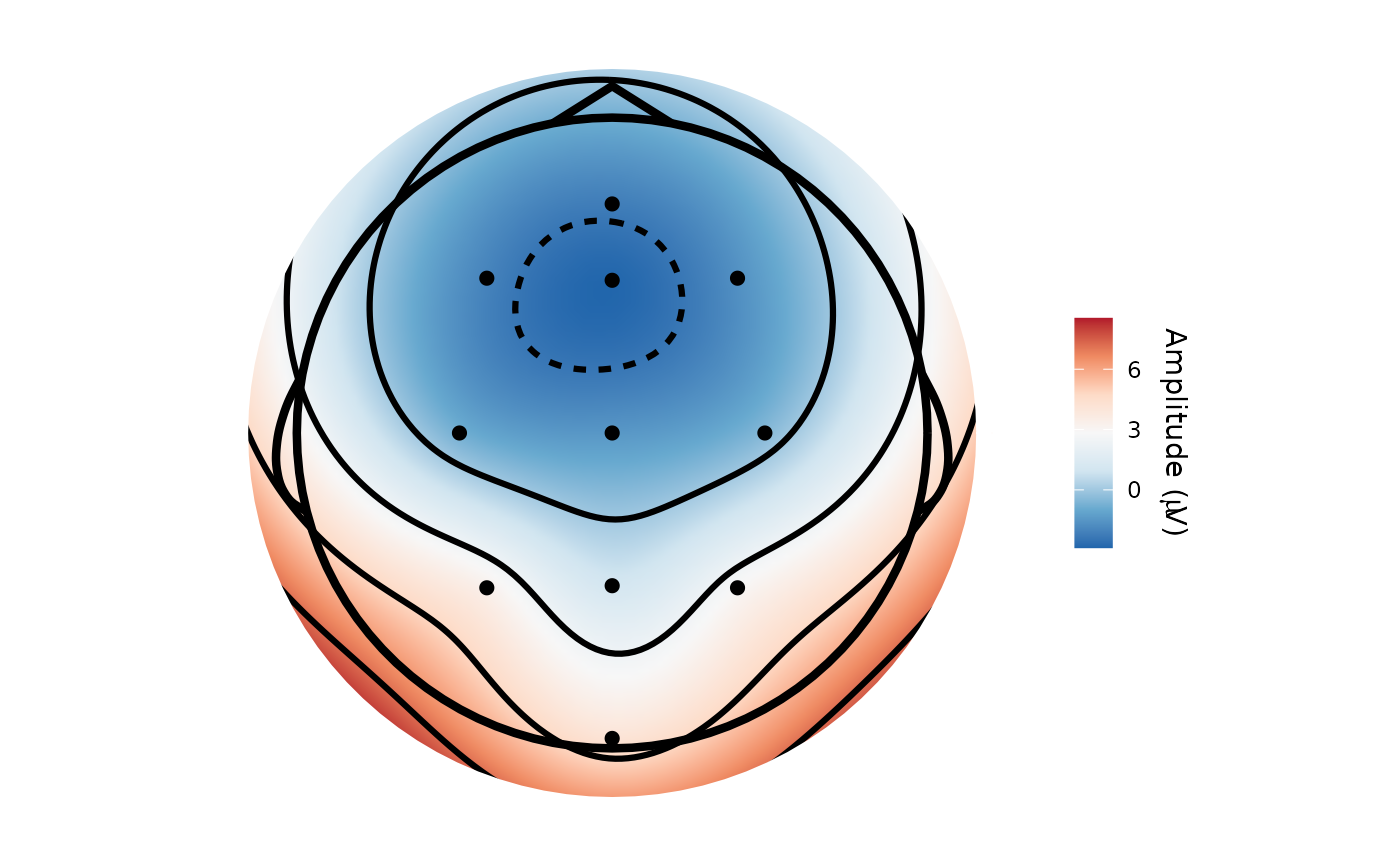
topoplot(demo_epochs)
#> Creating epochs based on combinations of variables: epoch_label participant_id
#> Using electrode locations from data.
#> Plotting head r 95 mm
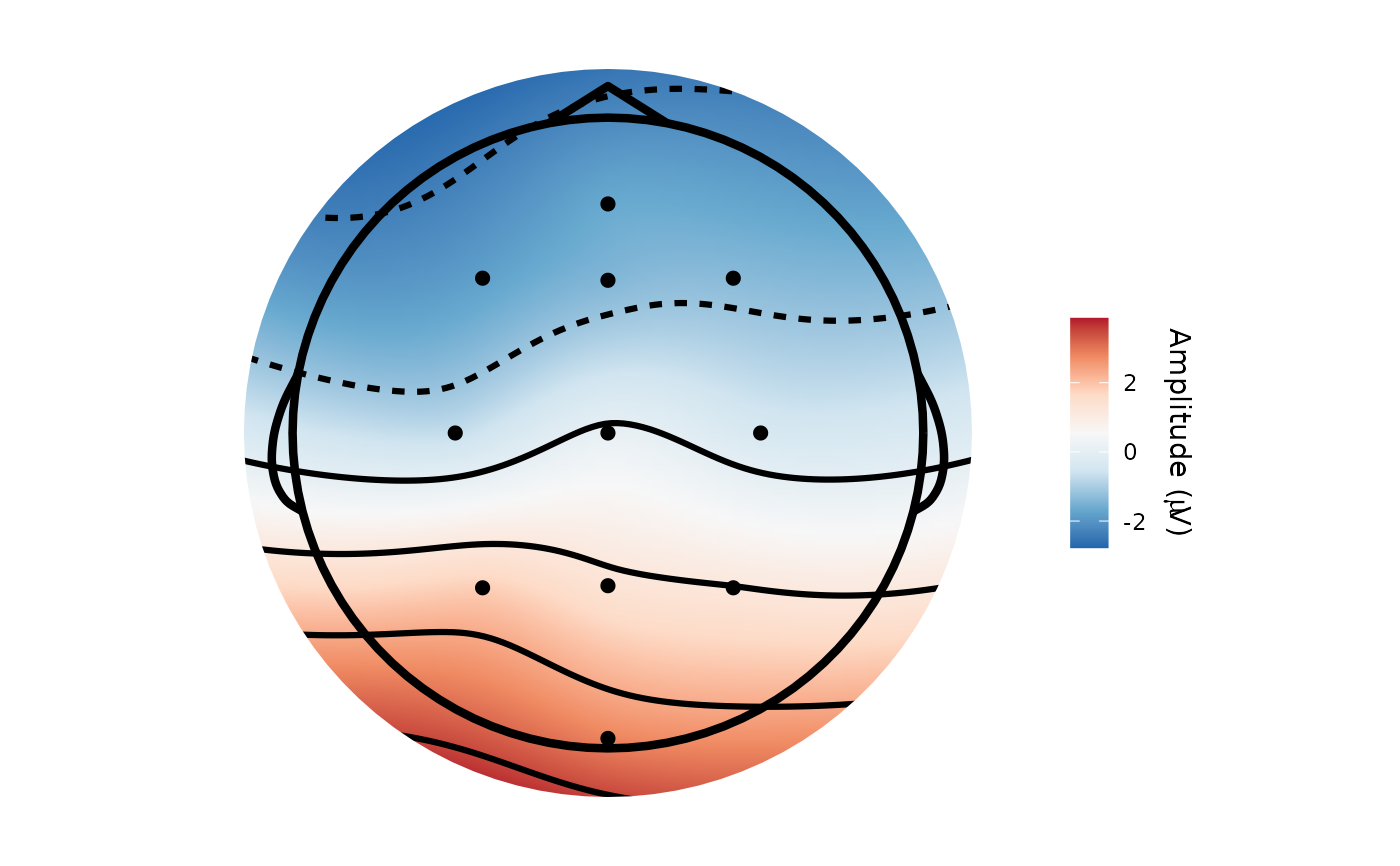
 topoplot(demo_epochs, time_lim = c(.1, .2))
#> Creating epochs based on combinations of variables: epoch_label participant_id
#> Using electrode locations from data.
#> Plotting head r 95 mm
topoplot(demo_epochs, time_lim = c(.1, .2))
#> Creating epochs based on combinations of variables: epoch_label participant_id
#> Using electrode locations from data.
#> Plotting head r 95 mm
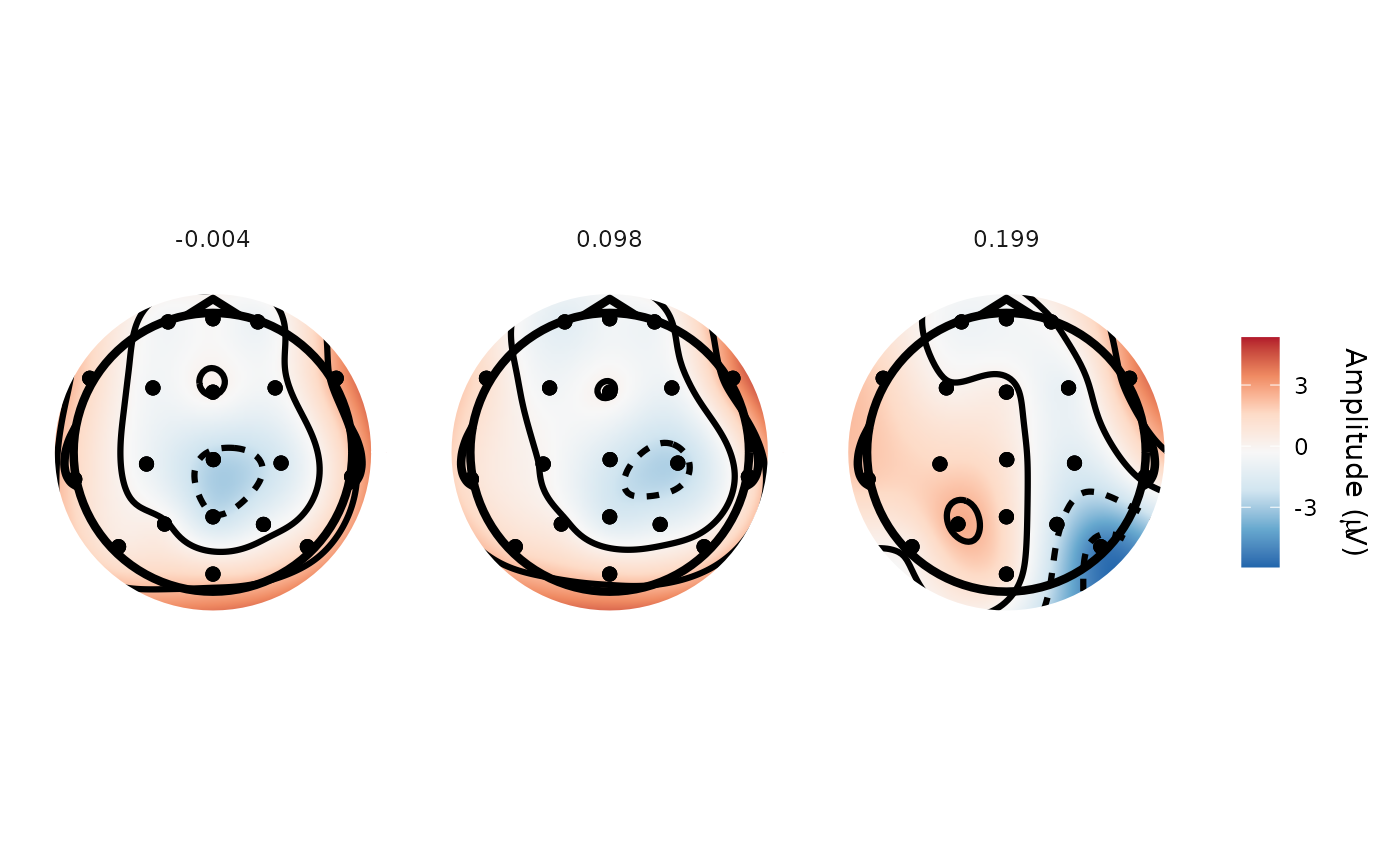
 topoplot(demo_spatial, time_lim = list(0, .1, .2))
#> Creating epochs based on combinations of variables: participant_id epoch_labels
#> Returning closest time points to those requested: -0.00391 0.0977 0.199
#> Using electrode locations from data.
#> Removing channels with no location.
#> Plotting head r 95 mm
topoplot(demo_spatial, time_lim = list(0, .1, .2))
#> Creating epochs based on combinations of variables: participant_id epoch_labels
#> Returning closest time points to those requested: -0.00391 0.0977 0.199
#> Using electrode locations from data.
#> Removing channels with no location.
#> Plotting head r 95 mm