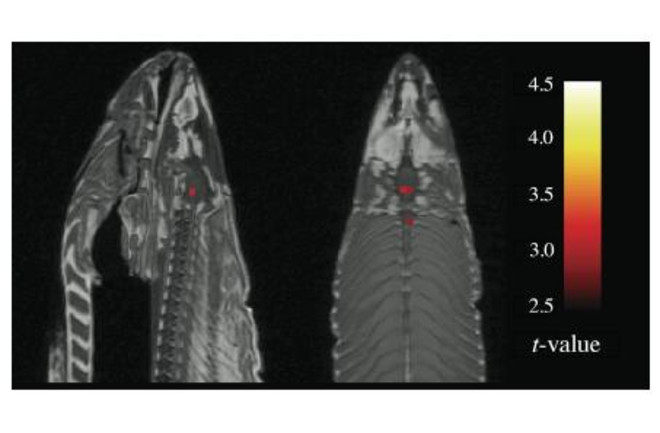
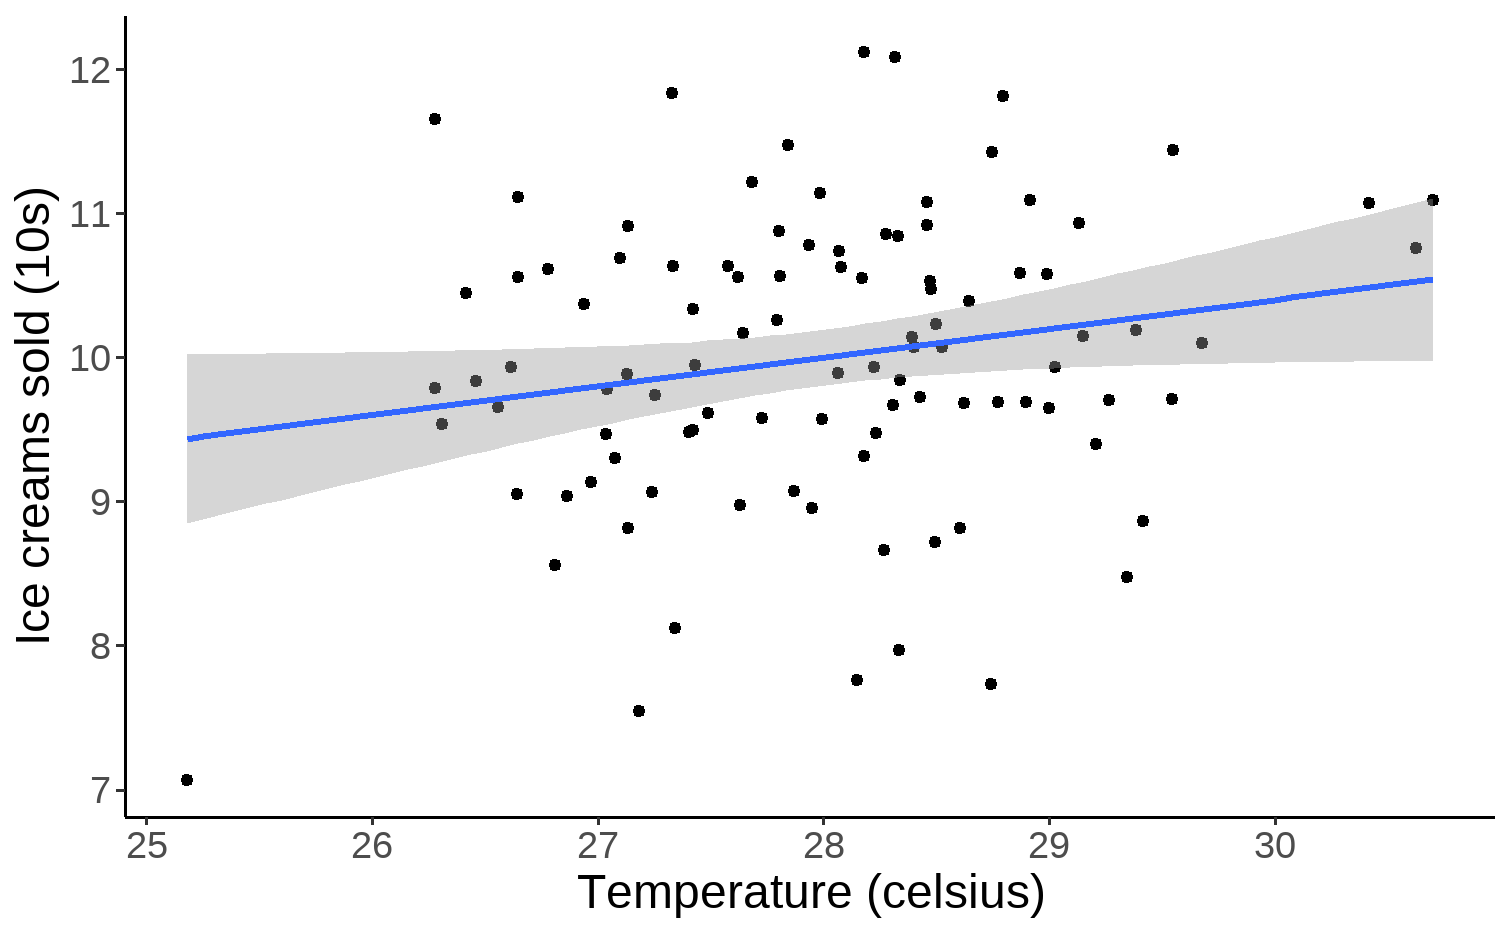
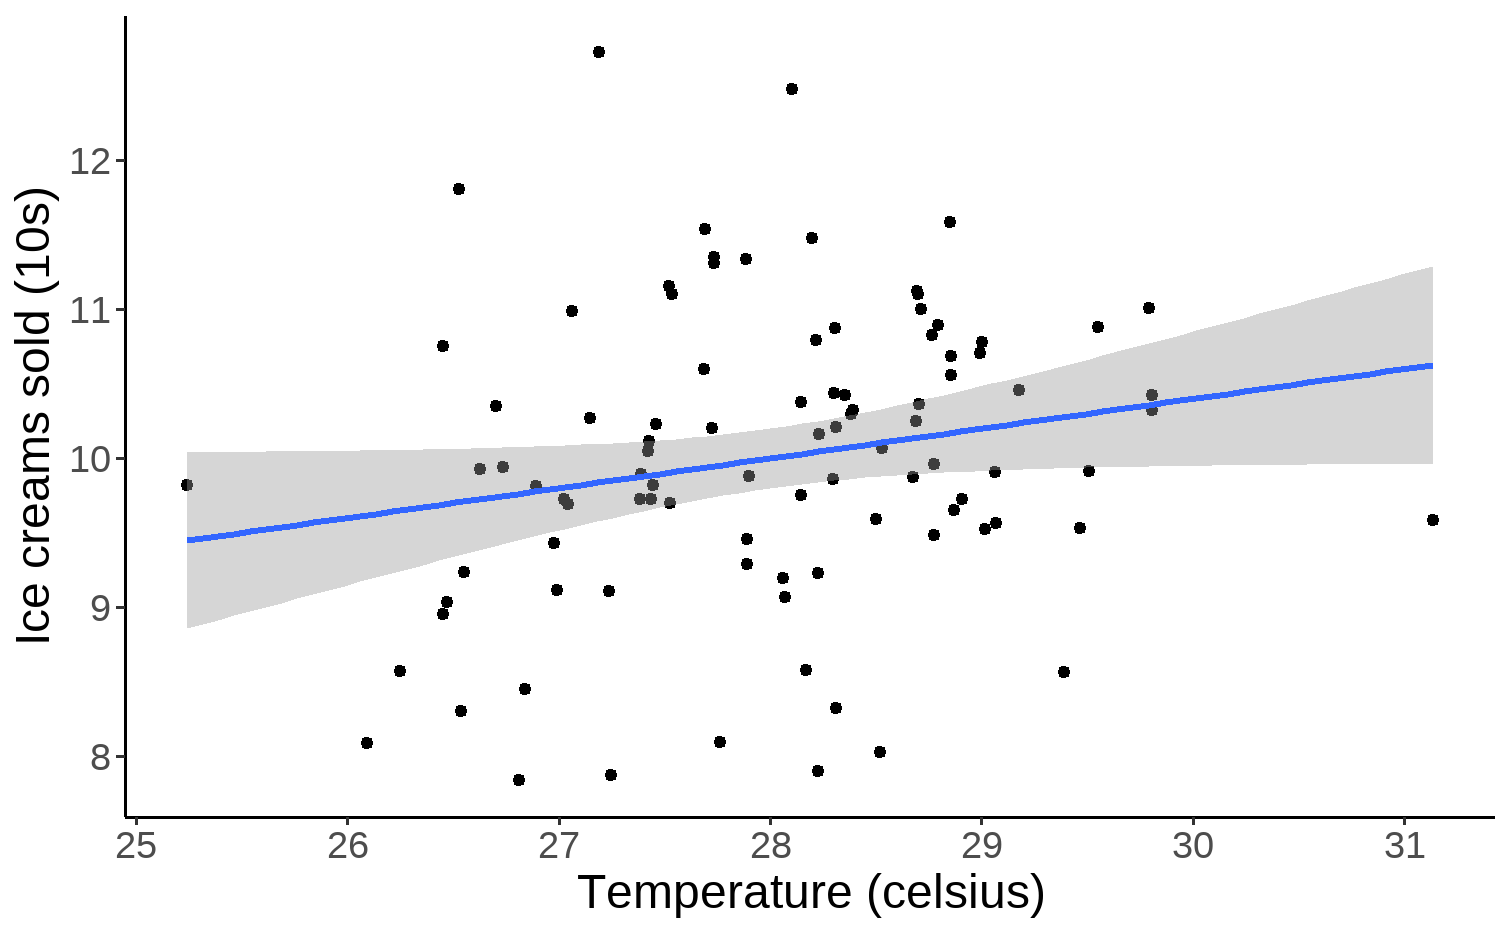
class: center, middle, inverse, title-slide # Stats done wrong ### 2021/05/11 --- class: center, middle, inverse # Questionable Research Practices --- # What are Questionable Research Practices? Questionable Research Practices (QRPs) are common, flawed research practices that are not outright fraud but can lead to false positives and a distorted picture of the true pattern of results. -- - publication bias (the file drawer problem) -- - selective reporting (cherry picking results you *want*) -- - selective stopping (stopping when you get the result you want) -- - flexible use of outliers -- - Hypothesising after the results are known (HARKing) -- - and more... ??? Inspired by the Neuroskeptic - https://figshare.com/articles/presentation/The_Resistable_Rise_of_Questionable_Research_Practices/1540908/2 --- background-image: url("https://upload.wikimedia.org/wikipedia/commons/a/a2/FloreAndWicherts2015_meta_analysis_sex_stereotype_threat.png") background-position: right background-size: contain # Publication bias .left-column[ The "file drawer" problem - only significant results tend to be published. Non-significant results go in the "file drawer". ] ??? Meta-analysis of stereotype threat on girls' math scores showing asymmetry typical of publication bias. From Flore, P. C., & Wicherts, J. M. (2015)[16] --- # Selective reporting Selective reporting is reporting only those outcomes that suit the story you want to tell. An example: The US biotech company **InterMune** ran a clinical trial of a new drug for pulmonary fibrosis. They found no overall effect, but found a small subset of participants with mild-to-moderate for whom mortality was significantly reduced. The CEO of the company issued a press release reporting only the data from this small subset of participants; a later, larger trial found no benefit for these patients. (The CEO ended up with a criminal conviction for defrauding the company's investors!) ??? Example from Spiegelhalter, D., The Art of Statistics. --- # Selective stopping Selective stopping or "peeking" is when you repeatedly check for significance every few observations. .pull-left[ Once you find a significant result, you stop collecting data. This can *greatly* increase the rate of false positives. Here's a fantastic simulation of [Selective stopping](https://shiny.psy.gla.ac.uk/debruine/peek/) by [Lisa DeBruine](https://www.gla.ac.uk/researchinstitutes/neurosciencepsychology/staff/lisadebruine/) of the University of Glasgow. ] .pull-right[ <!-- --> ] --- # False positive psychology [Simmons, Nelson, & Simonsohn, 2011](https://journals.sagepub.com/doi/full/10.1177/0956797611417632) demonstrated how these problems can all come together to produce spurious results. They ran a study in which participants listened to either a children's song ("Hot potato" by the Wiggles) or a control song ("Kalimba", by Mr Scruff). Participants reported that they felt older after listening to the children's song than the control song. So they ran a second study... --- # False positive psychology If listening to children's songs made people *feel* younger, can listening to a song about being *older* make people *actually* younger. In their second study, participants listened to "When I'm Sixty-Four" by the Beatles or the control song. They also provided their birth date and their father's age. "An ANCOVA revealed the predicted effect: According to their birth dates, people were nearly a year-and-a-half younger after listening to “When I’m Sixty-Four” (adjusted M = 20.1 years) rather than to “Kalimba” (adjusted M = 21.5 years), F(1, 17) = 4.92, p = .040." --- # False positive psychology The authors used *every trick in the book* to get this effect. Here's an honest account of the second study: <!-- --> --- # How common are these problems? A [2012 study of over 2000 US psychologists](https://doi.org/10.1177%2F0956797611430953) found that - 35% said they'd reported an unexpected finding as having been predicted beforehand (HARKing) - 58% said they'd carried on collecting more data after seeing whether results were significant (optional stopping) - 67% said they had failed to report all of a study's outcomes (selective reporting) ??? John LK, Loewenstein G, Prelec D. Measuring the Prevalence of Questionable Research Practices With Incentives for Truth Telling. Psychological Science. 2012;23(5):524-532. doi:10.1177/0956797611430953 --- class: middle, center, inverse # Countering QRPs --- # Preregistering designs and protocols To guard against many of these practices, preregistration is often considered the gold standard. Clinical trials generally need to publicly preregistered - the outcomes that will be measured are declared in advance. Note that trials frequently still end up reporting different outcomes - but at least we can see that something suspicious is going on... [More information about clinical trial registration can be found here](https://www.hra.nhs.uk/planning-and-improving-research/research-planning/research-registration-research-project-identifiers/) --- # Preregistering designs and protocols Many journals now offer *Registered Reports* (e.g. [Cortex](https://doi.org/10.1016/j.cortex.2015.03.022)) In this format, the experimental methods and analysis plans are reviewed before the data is collected. This increases transparency, allows for feedback to be given before people run the study, and decouples the decision to publish from the significance of the results. --- # Preregistering designs and protocols <img src="https://media.nature.com/lw800/magazine-assets/d41586-018-07118-1/d41586-018-07118-1_16221760.png" width="60%" style="display: block; margin: auto;" /> ??? Figure from https://www.nature.com/articles/d41586-018-07118-1, based on Allen, C. & Mehler, D. Preprint at PsyArXiv https://psyarxiv.com/3czyt (2018). --- # ...but preregistration is not a panacea Preregistration helps to solve some poor statistical practices, such as cherry-picking and outcome-switching, and guards against publication bias. It doesn't necessarily help to generate better hypotheses, to develop better theories, or to ensure use of appropriate statistical methods. - [Is Pregistration Worthwhile? - Szollosi et al (2020)](https://doi.org/10.1016/j.tics.2019.11.009) - [The case for formal methodology in scientific reform - Devezer et al., 2021](https://doi.org/10.1098/rsos.200805) --- class: inverse, center, middle # A plethora of problems --- class: inverse background-image: url("https://imgs.xkcd.com/comics/significant.png") background-size: contain .left-column[ # Multiple comparisons image from [Xkcd](https://xkcd.com/882/) ] --- # Multiple comparisons An fMRI study ([Bennett et al.](https://teenspecies.github.io/pdfs/NeuralCorrelates.pdf)) examined the neural correlates of perspective taking. The subject was placed in the scanner and shown photographs of "human individuals in social situations with a specified emotional valence, either socially inclusive or socially exclusive." The task was "to determine which emotion the individual in the photo must have been experiencing." "A t-contrast was used to test for regions with significant BOLD signal change during the presentation of photos as compared to rest. The parameters for this comparison were t(131) > 3.15, p(uncorrected) < 0.001, 3 voxel extent threshold." --- # Multiple comparisons So where was this cluster? -- <!-- --> ??? [Neural Correlates of Interspecies Perspective Taking in the Post-Mortem Atlantic Salmon: An Argument For Proper Multiple Comparisons Correction](https://teenspecies.github.io/pdfs/NeuralCorrelates.pdf) --- # Multiple comparisons fMRI analyses involve running many, many, many tests at once. The authors of "Neural Correlates of Interspecies Perspective Taking in the Post-Mortem Atlantic Salmon: An Argument For Proper Multiple Comparisons Correction" deliberately did not use correction for multiple comparisons. -- With appropriate corrections, the spurious activity disappeared! "Statistics that were uncorrected for multiple comparisons showed active voxel clusters in the salmon’s brain cavity and spinal column. Statistics controlling for the familywise error rate (FWER) and false discovery rate (FDR) both indicated that no active voxels were present, even at relaxed statistical thresholds." --- class: inverse # Regression to the mean .pull-left[ <div class="figure"> <img src="7-stats-done-wrong_files/figure-html/unnamed-chunk-5-1.png" alt="Scatter plot of heights of 465 fathers and sons." width="504" /> <p class="caption">Scatter plot of heights of 465 fathers and sons.</p> </div> ] .pull-right[ The diagonal, dashed line on this plot indicates equality between the heights of fathers and sons. The regression line (blue) is clearly lower for fathers who are taller than average, and higher for fathers who are shorter than average. Tall fathers have slightly shorter sons; short fathers have slightly taller sons. This is **regression to the mean**. ] ??? Data and code from Spiegelhalter, D. The art of statistics. https://github.com/dspiegel29/ArtofStatistics/tree/master/05-1-sons-fathers-heights --- class: center, middle, inverse # Base rate fallacy --- # Base rate fallacy Imagine we are performing tests for some kind of disease. We have a test that is 90% sensitive: it correctly detects 90% of true cases. It has a false positive rate of 5%: it falsely returns a positive result 5% of the time. We run the test on 10000 people. What is the probability that a positive test is a *true* positive? --- # Base rate fallacy To answer the question, we need to know the *base rate*. If the disease affects 1 in 10 people, we'd expect 1000 true cases in 10000 people. Out of those 1000 cases, the test would successfully detect **900** cases. The test has a false positive rate of 5%, so we'd also get **50** false positives. We would detect 950 cases in total; 900 of those would be true positives. So the probability of a positive being a *true* positive is 900 / 950: **95%**. --- # Base rate fallacy Now suppose that the disease affects 1 in 1000 people. We'd expect 10 true cases in 10000 people. Out of those 10, we'd detect 9 cases. But we'd still get **50** false positives! So the probability of a positive being a true positive is 9/59: **15%**, not **90%**! --- # Base rate fallacy .center[Prevalence: 1 in 10] | |Infected| Not infected| Total| |-|----------------------|----| |Test positive|900|50|950| |Test negative|100|8950|9050| |Total|1000|9000|10000| When prevalence is high, a positive is **very likely** a true positive. --- # Base rate fallacy .center[Prevalence: 1 in 1000] | |Infected| Not infected| Total| |-|----------------------|----| |Test positive|9|50|59| |Test negative|1|9940|9851| |Total|10|9990|10000| When prevalence is low, a positive is **very unlikely** to be a true positive. --- class: inverse, center, middle # Erroneous analysis of interactions --- .pull-left[ <img src="7-stats-done-wrong_files/figure-html/ic-sig-1.png" width="504" /> ] .pull-right[ We check the ice cream sales from the MR WHIPPY VAN. We find that there is a significant correlation between ice cream sales and temperature. ] ```r correlation::cor_test(icecreams, "Temp", "ic_sales") ``` ``` ## Parameter1 | Parameter2 | r | 95% CI | t(99) | p ## -------------------------------------------------------------- ## Temp | ic_sales | 0.20 | [0.00, 0.38] | 2.03 | < .05* ## ## Observations: 101 ``` --- .pull-left[ <img src="7-stats-done-wrong_files/figure-html/ic-notsig-1.png" width="504" /> ] .pull-right[ We now check the ice cream sales from MR FROSTY'S VAN. We find that there is no significant correlation between ice cream sales and temperature. ] ```r correlation::cor_test(icecreams, "Temp", "ic_sales") ``` ``` ## Parameter1 | Parameter2 | r | 95% CI | t(93) | p ## -------------------------------------------------------------- ## Temp | ic_sales | 0.20 | [ 0.00, 0.39] | 1.97 | 0.052 ## ## Observations: 95 ``` --- .pull-left[  ] .pull-right[  ] If we directly compare the correlations, there is no significant difference between them! ```r psych::paired.r(.2, .2, n = 101, n2 = 95) ``` ``` ## Call: psych::paired.r(xy = 0.2, xz = 0.2, n = 101, n2 = 95) ## [1] "test of difference between two independent correlations" ## z = 0 With probability = 1 ``` --- # Erroneous analysis of interactions <img src="https://media.springernature.com/full/springer-static/image/art%3A10.1038%2Fnn.2886/MediaObjects/41593_2011_Article_BFnn2886_Fig1_HTML.jpg?as=webp" width="80%" /> These are examples of comparisons between groups where an effect is significant and groups where it is not. It's tempting to say the effect is there in one group but not the other. ??? [Erroneous analyses of interactions in neuroscience: a problem of significance](https://www.nature.com/articles/nn.2886) --- # Erroneous analysis of interactions "We reviewed 513 behavioral, systems and cognitive neuroscience articles in five top-ranking journals (Science, Nature, Nature Neuroscience, Neuron and The Journal of Neuroscience) and found that 78 used the correct procedure and 79 used the incorrect procedure. An additional analysis suggests that incorrect analyses of interactions are even more common in cellular and molecular neuroscience." [Erroneous analyses of interactions in neuroscience: a problem of significance](https://www.nature.com/articles/nn.2886) [The Difference between "Significant" and "Not Significant" is not Itself Statistically Significant](http://www.stat.columbia.edu/~gelman/research/published/signif4.pdf) --- class: center, middle, inverse # Selection bias --- # Selection bias Selection bias is when the participants, groups, or data are selected in such a way as to make them unrepresentative of the population of interest. Selection bias comes in many forms - for example: - volunteer bias - attrition bias - susceptibility bias These biases can undermine the validity of the results! --- # Survival bias .pull-left[ <img src="https://upload.wikimedia.org/wikipedia/commons/thumb/b/b2/Survivorship-bias.svg/1200px-Survivorship-bias.svg.png" width="60%" /> ] .pull-right[ The US Military thought that the best place to add armour was where planes that returned home after missions had been shot the most often. The statistician Abraham Wald pointed out that the planes that didn't make it back must have been shot in the *other* areas. ] ??? Example drawn from wikipedia https://en.wikipedia.org/wiki/Survivorship_bias --- # Collider bias .pull-left[ <img src="7-stats-done-wrong_files/figure-html/unnamed-chunk-11-1.png" width="504" /> ] .pull-right[ Trustworthiness and newsworthiness both *cause* publication. The publication process tends to select papers that are either **very trustworthy** or **very newsworthy**. After selecting a subset, there is a **negative** correlation between trustworthiness and newsworthiness. ] ??? This example uses code from Solomon Kurz's bookdown translation of McElreath's Statistical Rethinking: https://bookdown.org/content/4857/the-haunted-dag-the-causal-terror.html --- # Collider bias .pull-left[ <img src="7-stats-done-wrong_files/figure-html/unnamed-chunk-12-1.png" width="504" /> ] .pull-right[ When we don't select based on whether and article was published, what do we get? **No** correlation between trustworthiness and newsworthiness. ] ??? This example uses code from Solomon Kurz's bookdown translation of McElreath's Statistical Rethinking: https://bookdown.org/content/4857/the-haunted-dag-the-causal-terror.html --- class: inverse, center, middle # Outright errors --- # Excel mistakes There are a number of famous mistakes made when using Excel. An example: Genes are given symbolic names. e.g. *SEPT2* (Septin 2) and *MARCH1* [Membrane-Associated Ring Finger (C3HC4) 1, E3 Ubiquitin Protein Ligase] Excel, by default, converts those to the *dates* '2-Sep' and '1-Mar' respectively. [Gene name errors are widespread in the scientific literature - Ziemann, Eren, El-Osta, 2016](https://genomebiology.biomedcentral.com/articles/10.1186/s13059-016-1044-7) --- # Reporting mistakes Nuijten, Hartgerink, van Assen, et al. (2016) looked at the prevalence of simple reporting errors in psychological journals: "we found that half of all published psychology papers that use NHST contained at least one p-value that was inconsistent with its test statistic and degrees of freedom. One in eight papers contained a grossly inconsistent p-value that may have affected the statistical conclusion" [statcheck.io](http://statcheck.io/index.php) [Nuijten, Hartgerink, van Assen, et al. The prevalence of statistical reporting errors in psychology (1985–2013), 2016](https://doi.org/10.3758/s13428-015-0664-2) --- class: inverse, middle, center # What to do about all this? --- class: inverse, center, middle Statistics is HARD. -- Mistakes are inevitable. -- Try not to fool yourself. -- Think carefully about how to handle bias -- Make your work transparent! --- # Additional resources [the100.ci blog](http://www.the100.ci) Collider bias: http://www.the100.ci/2017/03/14/that-one-weird-third-variable-problem-nobody-ever-mentions-conditioning-on-a-collider/ Multiverse analysis: http://www.the100.ci/2021/03/07/mulltiverse-analysis/ [Thinking Clearly About Correlations and Causation: Graphical Causal Models for Observational Data, Rohrer, J., 2018](https://journals.sagepub.com/doi/full/10.1177/2515245917745629) [Statistical rethinking](https://xcelab.net/rm/statistical-rethinking/)