class: center, middle, inverse, title-slide # Introduction ## Research Methods and Skills ### 13/10/2020 --- # Who are we? .pull-left[ | Dr Matt Craddock | |------------------------------| |  | |Sarah Swift Building Room 2226| |mcraddock@lincoln.ac.uk | ] .pull-right[ | Dr Tochukwu Onwuegbusi | |------------------------------| |  | |Sarah Swift Building Room 2211| |tonwuegbusi@lincoln.ac.uk | ] --- class: center, middle, inverse # Replicability and reproducibility --- background-image: url(images/01/headlines-repro.png) --- background-image: url(images/01/F1.large.jpg) background-size: contain [Open Science Collaboration, 2015](dx.doi.org/10.1126/science.aac4716) --- # Scenario A .large[ You've just started work in a psychology lab. You're asked to help analyse some old data. There is reaction time data from 50 participants. Each participant's data is stored in a separate text file. - How do you combine the data from each participant together to be able to analyse the data? - It turns out some of the participants only completed part of the experiment - which ones, and what should you do with their data? - What steps should you take to select and perform appropriate statistical analysis? ] --- # Scenario B .large[ You've been asked to design, implement, and evaluate a new treatment regime across several psychiatric institutes. Several colleagues are skeptical that it can deliver the kind of improvements in outcomes indicated in a publication describing the method. - How do you interpret the strength of the previously published evidence? - How do you design a rigorous test of the treatment efficacy? - How do you evaluate and report on the outcomes of your trial? ] --- # Research Methods and Skills -- .pull-left[  ] -- .pull-right[  ] --- # Course outline .pull-left[ ### Weeks 1-5 - Introduction to R - Basic R programming - Plotting with ggplot2 - Data import, selection and manipulation - Describing and summarising your data ] .pull-right[ ### Weeks 5, 7-10 - Hypothesis testing and estimation - *t*-tests and comparing two groups - Correlation and linear regression - One-way ANOVA - Factorial ANOVA ] ### Weeks 11-13 - Qualitative methods --- # Course outline .pull-left[ ### Weeks 1-5  ] .pull-right[ ### Weeks 5, 7-10  ] --- # Course outline .pull-left[ ### Weeks 1-5 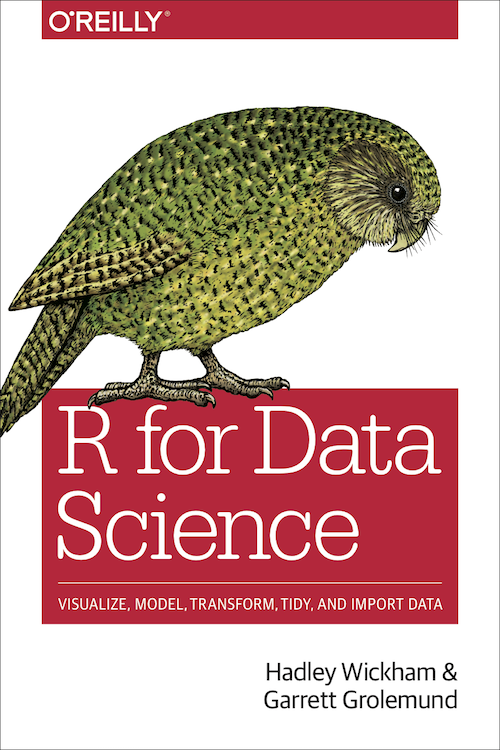 ] .pull-right[ ### Weeks 5-10 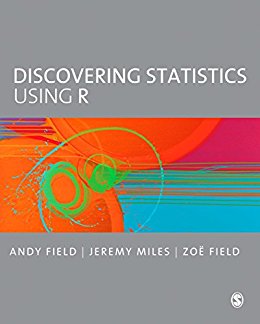 ] --- # How it's going to work .large[Each week you'll be provided with a set of pre-recorded videos introducing several core topics. You'll be provided with some statistical exercises to work on. More detail on that later! Timetabled sessions are: 1) **Optional** 2) **For Q & A and support** Come along to the timetabled sessions and work on the exercises, or come prepared with questions. If you get stuck **ask us**!] --- class: inverse, center, middle # Introduction to R and RStudio --- background-image: url(https://www.r-project.org/Rlogo.png) background-position: 80% 10% # What is R? .large[ R is a statistical, mathematical programming language * Created in 1993 * Designed from the ground up to support many statistical tasks * Covers all aspects of data analysis from import through to production of reports * Free, open source * Can be downloaded from the [R-project](https://r-project.org) website * Continually evolving * R has over 12,000 *packages* that add additional functions ] --- class: inverse, center, middle # But WHY? --- # What can you do with R? .center[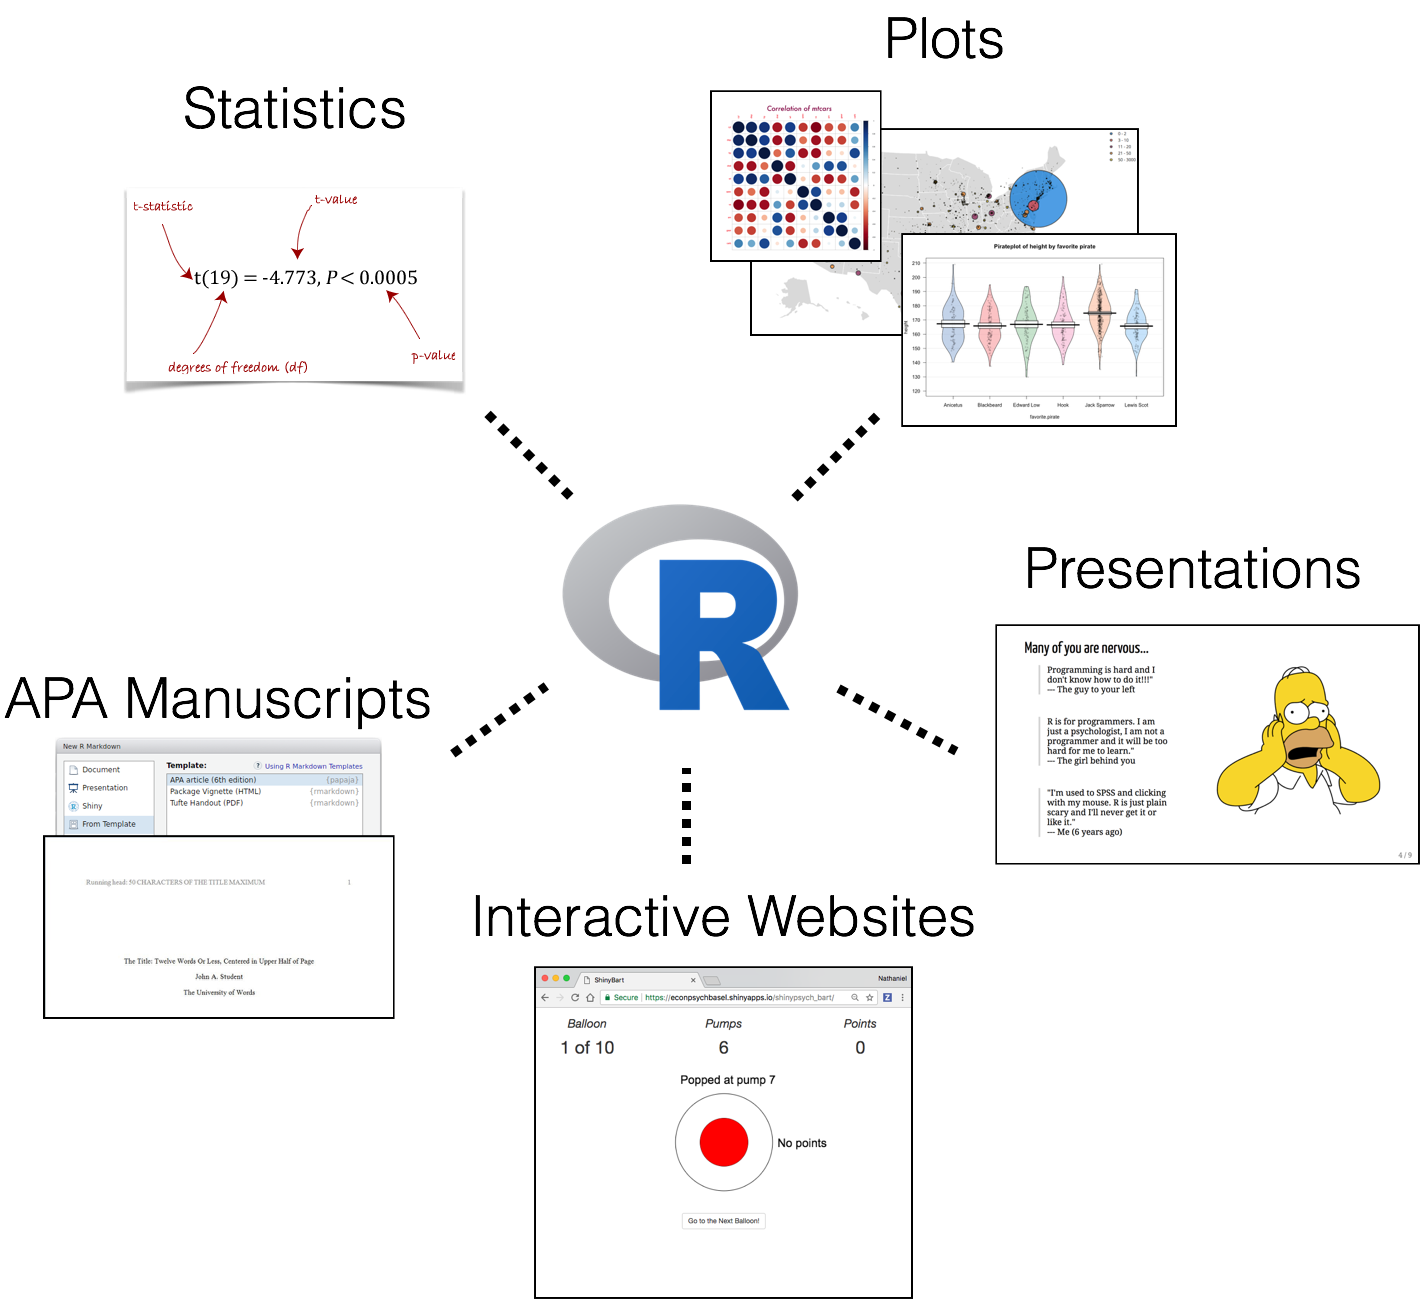] [Source: N. D. Phillips](https://ndphillips.github.io/IntroductionR_Course/presentations/Day_0_pres.html#4) --- background-image: url(images/01/Rcompanies.png) background-size: contain --- background-image: url(images/01/spss_usage.png) # Still not convinced? --- class: inverse, center, middle # Getting started --- background-image: url(images/01/RStudio-logo.png) background-size: 30% background-position: 80% 5% # What is RStudio? .large[ - An **Integrated Development Environment (IDE)** - An interface for R that makes your life much, much easier - Makes many things explicit that you would otherwise have to guess ] 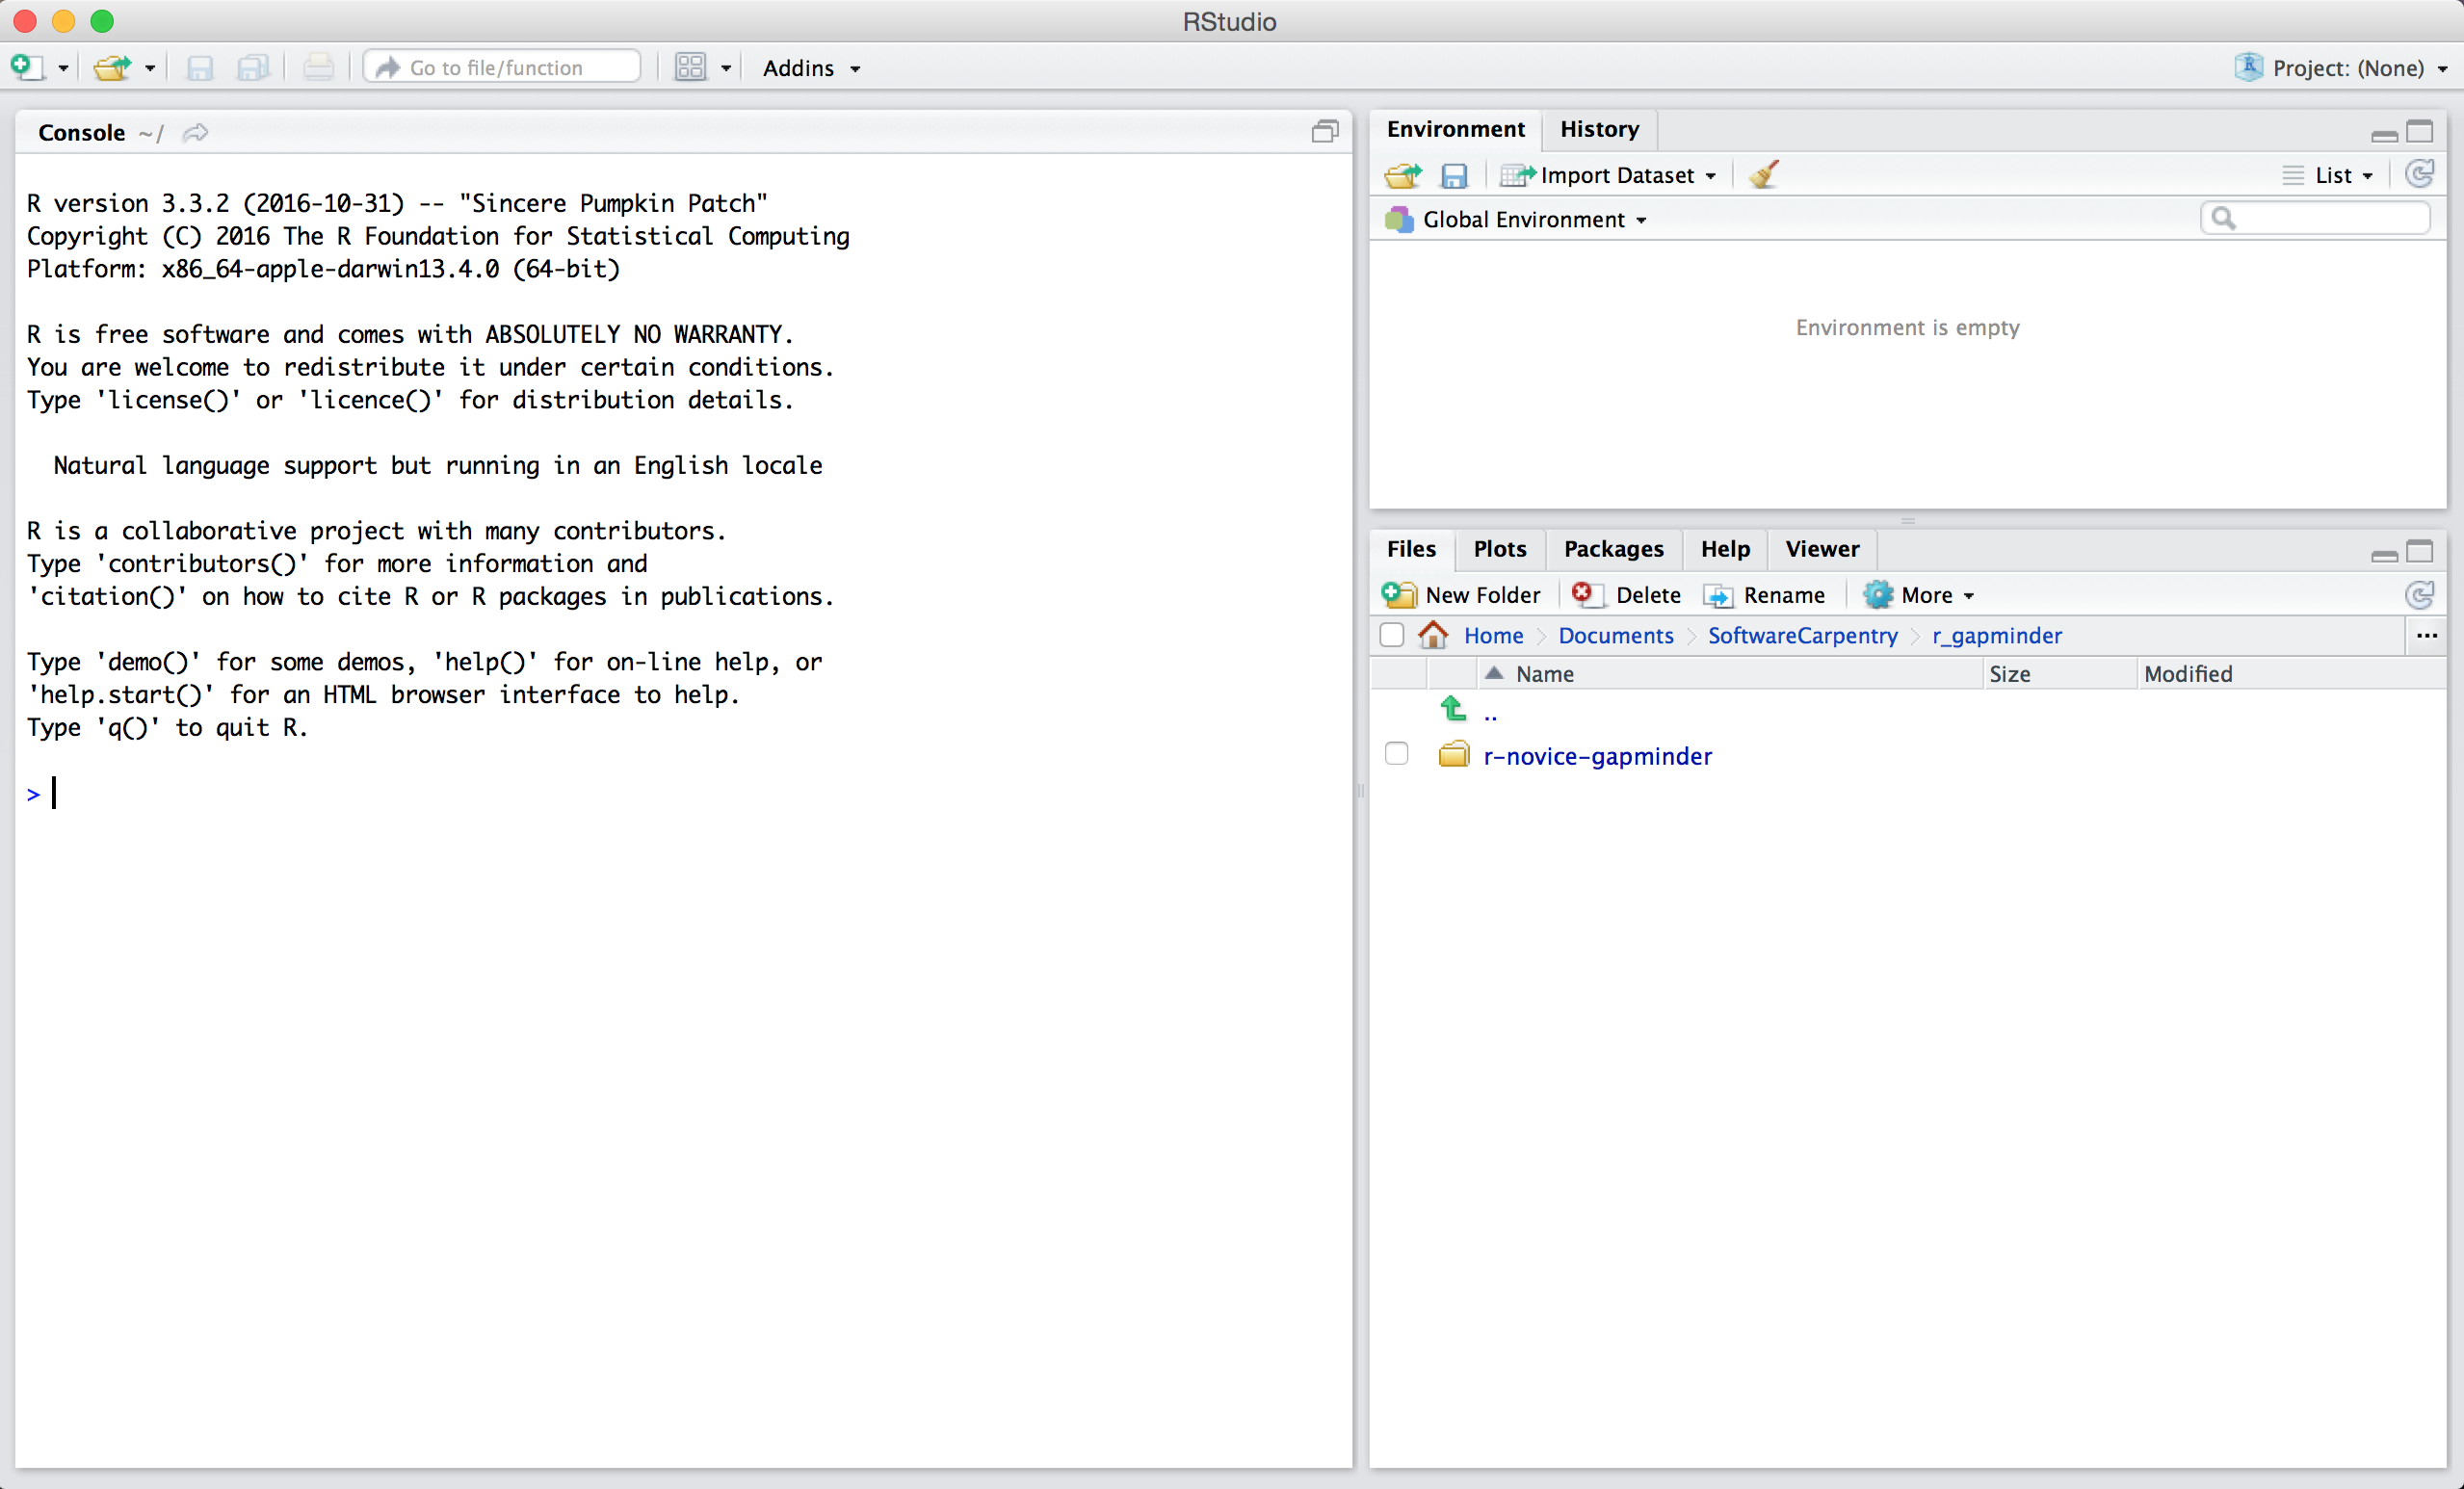 --- background-image: url(images/01/rstudiocloud_page.png) background-size: 50% background-position: 50% 90% # Getting started .large[ 1. Open up a web browser 2. Go to https://rstudio.cloud 3. Sign up! Use your REAL NAME, and your University of Lincoln email address. ] --- background-image: url(images/01/RStudioCloud.png) background-size: contain class: inverse --- background-image: url(images/01/RStudioCloud_proj_circ.png) background-size: contain class: inverse --- background-image: url(images/01/default_project.png) background-size: contain class: inverse --- background-image: url(images/01/cloud-tools.png) background-size: contain class: inverse --- background-image: url(images/01/cloud-appear.png) background-size: contain class: inverse --- class: inverse, center, middle # How it works! --- background-image: url(images/01/proj_console.png) background-size: contain class: inverse --- background-image: url(images/01/proj_console_repl.png) background-size: contain class: inverse --- # How to use R * The R Console * REPL: Read/Evaluate/Print/Loop * Type stuff in, it tries to do it When you see the **>** symbol - ```r *> ``` ... R is waiting for your input. ```r > 5 [1] 5 ``` --- # Warming up Try using R like a calculator! ### Basic arithmetic operators |Symbol |Operation | |:------|:--------------| |+ |addition | |- |subtraction | |* |multiplication | |/ |division | |^ |exponentiation | |%% |modulo | --- # Warming up You can break up long maths expressions over multiple lines: ```r 2 + 4 + 5 + 5 + 6 + 7 + 8 + 10 ``` ``` ## [1] 47 ``` Note that when you do that, the ">" symbol changes to a "+" ```r > 5 + *+ 5 [1] 10 ``` --- # Remember! .large[**>** means R is waiting for input.] ```r > ``` .large[**+** means R is waiting for you to finish your command.] ```r + ``` Either finish your command, or press the **Esc** key to cancel it. --- # Text input R can also accept text strings as input. ```r "hello world!" [1] "hello world!" ``` You need to use quotation marks ("") to tell R that this is text: ```r hello world! ``` ``` ## Error: <text>:1:7: unexpected symbol ## 1: hello world ## ^ ``` Otherwise, you'll receive an error like the one above. --- # Why is there an error? In R, you can assign values to an **object** for subsequent use. **Objects** have names that are written as text. The assignment operator is the two-character symbol: ```r *<- ``` You assign values to objects by putting the **<-** sign between the name of the object and the value you want to give it: ```r example <- 5 example ``` ``` ## [1] 5 ``` Note that R does not immediately provide output when you assign the output to an object. --- # The assignment operator .large[Think of **<-** as meaning "is now". i.e. ```r example <- 5 ``` can be read as ```r The object "example" is now 5 ``` ] --- # Working with objects Once an object is assigned, the name that you gave it *stands in* for the *value* that you assigned to it, and can be used as if it were that value: ```r example ``` ``` ## [1] 5 ``` ```r example + 10 ``` ``` ## [1] 15 ``` ```r example + 13 - 1 * 2 %% 4 ``` ``` ## [1] 16 ``` --- background-image: url(images/01/cloud_environ.png) background-size: contain class: inverse --- background-image: url(images/01/cloud_environ2.png) background-size: contain class: inverse --- background-image: url(images/01/cloud-history.png) background-size: contain class: inverse --- class: inverse, center, middle # Try it out! --- # Try a few things out! 1. Assign some values to objects using the assignment operator (**<-**) 2. Try using arithmetic operations (e.g. *, /, %%) on those objects 3. Try using arithmetic operations to combine multiple numerical objects 4. Try using arithmetic operations on text --- # Combining multiple things Sometimes you want to allocate more than one value to an object. You can use the **c()** function to do this. ```r c(8, 5, 10) ``` ``` ## [1] 8 5 10 ``` ```r example <- c(8, 5, 10) example ``` ``` ## [1] 8 5 10 ``` ```r c("hello", "how", "are", "you") ``` ``` ## [1] "hello" "how" "are" "you" ``` ## IMPORTANT: BRACKETS () AFTER A WORD MEAN THAT THIS IS A **FUNCTION** --- # Vectors The function **c()** is creating **vectors**. Vectors are simply a one-dimensional collection of things that all have the same *type* (we will cover data types next week!). Note that mixing, for example, text and numbers, will yield a *character* vector. ```r c(5, "five", 2) ``` ``` ## [1] "5" "five" "2" ``` --- # Functions Functions are commands that operate on **objects**. For example, to calculate the *mean* of several numbers, you can use the function **mean()**. The output of functions can also be assigned to **objects** using **<-**. ```r mean(c(8, 5, 10)) ``` ``` ## [1] 7.666667 ``` ```r example <- c(8, 5, 10) mean(example) ``` ``` ## [1] 7.666667 ``` ```r example_mean <- mean(example) example_mean ``` ``` ## [1] 7.666667 ``` --- # Try it out! 1. Use **c()** to create a vector of numbers. 2. Use **c()** to create a vector of strings. 3. Calculate the **mean()** of a vector of numbers. 4. Try guessing some other simple statistics (e.g. other types of *average*) that you can use. --- background-image: url(images/01/cloud-help.png) background-size: 40% background-position: 50% 75% # Getting help If you don't know how to use a function, R has built-in help! There are several ways you can access it: ```r help("mean") ?mean ??mean ``` --- # Packages Packages are the key to R's versatility. Over 12000 are currently available from the **Comprehensive R Archive Network** - [CRAN](https::https://cran.r-project.org/). The **install.packages()** function can be used to install packages. Let's install the "cowsay" package. **cowsay** is an extraordinarily useful package, as you'll see. One way to install the package is using the console: ```r install.packages("cowsay") ``` Once it's installed, use the **library()** function to load the package! ```r library(cowsay) ``` But **another** way to install is using the GUI! --- background-image: url(images/01/cloud-packages.png) background-size: contain class: inverse --- background-image: url(images/01/cloud-cowsay.png) background-size: contain class: inverse --- background-image: url(images/01/cloud-help.png) background-position: 90% 85% background-size: 40% # Try out the **cowsay** package **cowsay** adds a function called **say()**. Load the function in as follows, and look at the help for **say()**. ```r library(cowsay) ?say() ``` .left-pull[ Remember that help appears in the bottom right window! Look at **Usage** and **Arguments** **Usage** is how to use the function. **Arguments** are what the functions expect and understand. ] --- ```r say(what = "Feed me, human.", by = "cat") ``` ``` ## ## -------------- ## Feed me, human. ## -------------- ## \ ## \ ## \ ## |\___/| ## ==) ^Y^ (== ## \ ^ / ## )=*=( ## / \ ## | | ## /| | | |\ ## \| | |_|/\ ## jgs //_// ___/ ## \_) ## ``` --- # Try out the say() function 1. Try a few different animals by changing the **by** argument 2. Change what the animals say by changing the **what** argument. 3. Assign the output to an object using the **<-** operator. 4. Print out the value that you assigned to the object. --- # Additional resources .pull-left[  ] .pull-right[  ] There are copies of both these books in the library. R for Data Science is available freely online at http://r4ds.had.co.nz/ --- background-image:url(images/01/hopr-cover.png) background-size: 25% background-position: 85%, 25% # An additional recommendation... ## Hands-on Programming with R Basic R programming book, also available for free online https://rstudio-education.github.io/hopr/index.html --- # This week's goals 1. Make sure you're signed up for [RStudio.cloud](https://rstudio.cloud) 2. Read through Chapter 1 of [R for Data Science](https://r4ds.had.co.nz/introduction.html) 3. Try out some of the introductory things mentioned in the slides, just to get a feel for using RStudio!